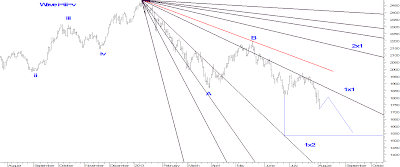
Nifty Mid Cap to move till 1550
Nifty Mid Cap is moving
in a down trend by forming a lower high and a lower low formation. On 31st
of July 2013 prices broke its crucial support of 1802 and moved lower till 1722
as on 2nd August 2013. This clearly suggests that prices are
negatively poised and has the tendency to move lower.
To justify our view
we have used advance technical tools to find out the desired support and
resistance of this index.
We have used Gann
Fann and have placed it on the top made on 9th January 2013 from
there on prices have moved below 1x1 line which is a very crucial to identify
the support and resistance. Currently prices are below this line which clearly
suggests that it is facing the resistance of this line. As far as prices move
below this our favored view for this particular index is negative and can move
lower till 1550 levels.
Nifty Mid Cap Daily
Chart
We will not be
publishing the method to forecast in this article


Comments