Bank Nifty Anticipated Happened
Bank Nifty was the
only index who showed tremendous weakness from past 2 months, but is there
still pain left in this index?
The answer to the
above question can be provided through advance technicals such as Elliott Wave
analysis that gives us an objective answer. Combining Elliott wave along with
simple technicals such as channels, retracements, projections helps us to
understand the possible resistance and support levels.
The following excerpt
is been picked from our research report.
Bank
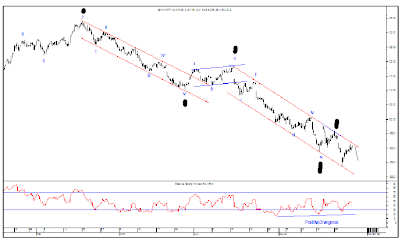
Nifty 120 mins chart (Anticipated on 2nd September)
Bank
Nifty 120 mins chart (Anticipated Happened)
Analysis:
Bank Nifty is an
index which includes banking stocks such as SBI, ICICI Bank, Axis Bank, HDFC
Bank etc. As seen in daily chart, prices in May 2013 made a high of 13414 and
thereafter it fell down steeply particularly from July 2013. Prices have
arrived near the resistance of the blue channel; a move below 8904 will provide
a confirmation that the down trend is still to stay.
From 120 mins chart
we can observe that prices are moving in a red falling channel and on Friday it
failed to breach this channel. A move below 8904 will open negative
possibilities and prices can move down lower till 8700. However, momentum
indicator RSI is exhibiting positive divergence (shown by blue line).
As per wave
perspective, prices are moving in a Wave …. after completing wave …. in a
Extended Flat correction. Wave …. is impulsive and has …. legs, recently it
completed wave …. at 9586 and currently it is moving down in the form of wave ….
of wave ….
In short, a move
below 8904 will provide first negative possibility that prices can move down to
8700 over short term.


Comments