IDBI: Channel Break out and Elliott Wave Counts
IDBI Bank comes under
the head of NSE Midcap 50. On Tuesday, NSE Midcap 50 was down by 1.46% which
was the highest fall as compared to past 6 days of trading.
On October 09, 2013
IDBI Bank offered Home loan and Auto loan on Base rate which is currently at
10.25%. It has also decided to waive the processing fee for both House loan and
Auto loan during this period. All these factors indicate positivity for this
stock, if this was the case why IDBI Bank could not perform?
Using combination of
simple technicals like channels, retracements etc and advance technicals like
Elliott Wave counts we were very accurate in mentioning the level of IDBI Bank
as it could move till 64-64.50. On Monday, 14th October 2013 IDBI made
a high of 64.50 and reversed.
We have now further
analyzed the movement of this stock using the combination of technical study
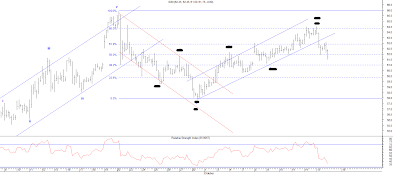
IDBI 60 mins chart
Analysis
From the above 60
mins chart, we can say that IDBI bank has bounced from 58 odd levels and made a
high of 64.50 recently. The level of 64.50 was a strong resistance as there
were cluster of resistance placed. For IDBI it was very difficult to cross it
and as a result it corrected by giving bearish break in rising blue channel
formation.
As seen daily chart,
IDBI after making a high in the early month of this year, the stock has
corrected significantly and is moving precisely in a falling channel. Yesterday
it made an attempt to break it, but whipsawed, that means it is failed pattern.
As per wave
perspective, …………………………
In short
……………………………………


Comments