Posts

Showing posts from March, 2014

Nifty: Moving in a Channelized Formation

Image
Nifty started gaining momentum especially after making a low of 5985 and moved up till 6723 levels in a span of one and half month and made a record high. This up move is very much similar to the move which occurred from December 2011 till February 2012 (marked by blue rectangle) where the index gained tremendously in spite of RSI staying in over bought zone for many weeks. This scenario is similar for the current rally as well, but how long this up move will sustain? Even with the help of simple technical analysis like channels, retracements etc and use of candlestick patterns, traders can easily understand resistance and reversal signals. Channels are two parallel lines which helps to know the support and resistance levels. From past 3 years Nifty is moving in a channelized formation. The formation is positive as it is making a higher high and higher lows, but on 31 st March 2014 prices faced the resistance of the upper trend line of the channel and has also formed a han...

JP Associates: Elliott wave counts and Forecasting.

Image
Infrastructure conglomerate   Jaiprakash Associates   signed an agreement to   sell   its 74 per cent stake in a   cement  manufacturing unit in Bokaro to   Dalmia Cement   (Bharat) for a   deal  that values the entity at around Rs1,150 crore. The proceeds of the   stake sale   will help Jaiprakash Associates in its plan to cut the Rs60,000 crore debt  on its books. It wants to slash debt by Rs15,000 crore by March end. In a  disclosure  to bourses, Jaiprakash said it will sell its entire  holding  of 74 per cent in the Bokaro  unit , of which   Steel Authority of India   owns 24 per cent, at Rs69.74 per share, which translates to about Rs690 crore for the stake. "The above stake  sale  is subject to the approval of   SAIL   and such other  approvals , as may be necessary from  lenders  of Bokaro Jaypee Cement and concerned authorities," Jaip...

Reliance Communications: Near Completion of Channelized Move and Elliott Wave Counts.

Image
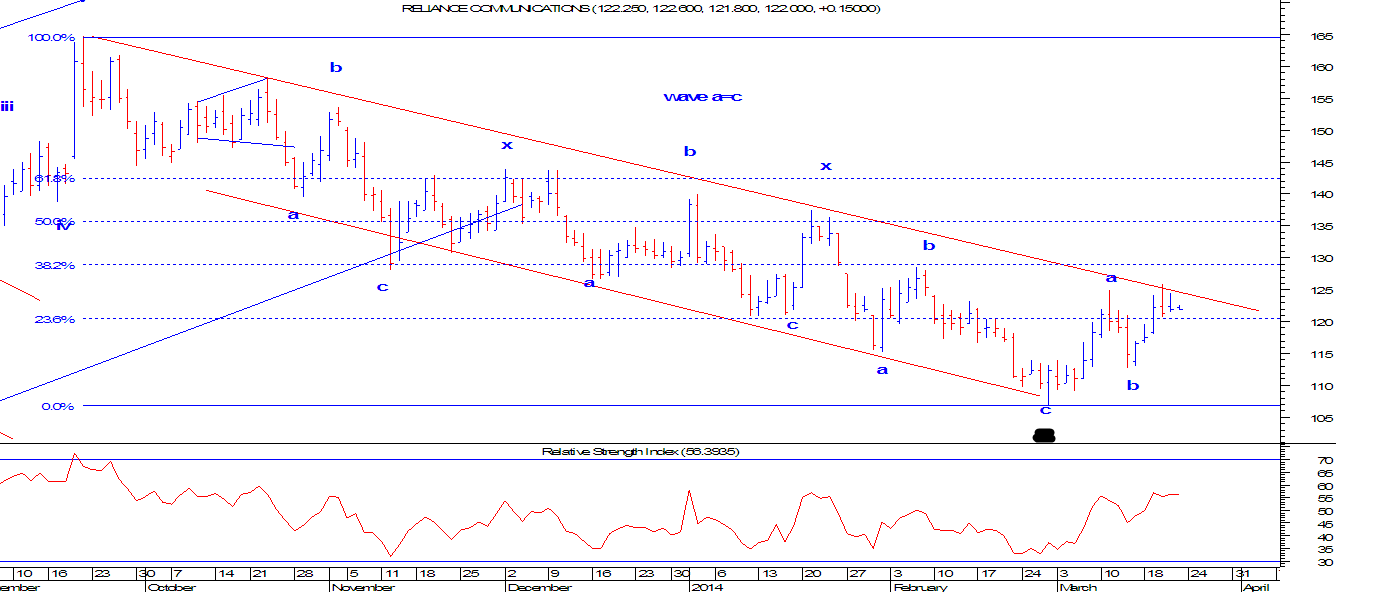
Telecom is one of the underperformer sector as compared to other sectors such as Banks, realty, MNC’s etc. This means the entire telecom pack which includes Bharti Airtel, Rel Com, Idea, Tata Com has not performed in sync with Nifty. We are going to discuss on Reliance communication as this stock has failed to show any positive momentum from past 6 months. It is not acceptable for this high beta stock to underperform even when Nifty moved up almost 1300 points on the upside in last 6 months. By applying the combination of basic technical analysis and Elliott wave theory it becomes easy to forecast the upcoming trend for a particular asset class. Simple technicals like channels, retracements etc help us to know the possible support and resistance for the asset class. From the below daily chart of Reliance communication, we can see clearly that prices are moving down after making a high of 164.65 on 20 th November 2013. Thereafter it failed to move above its high and sta...

Hang Seng: Anticipated Happened

Image
In our previous article on 10 th March 2014 we had mentioned that, “Using Elliott wave analysis we came to the conclusion that this index is going to underperform in coming months which can drag this index till its previous pivot low. Failure to protect this low will further infuse selling pressure. The index is quoting above the extended upward sloping lower trendline which has been providing support to this index from October 2011. Till now this support has been intact but sooner or later it may breach this support zone. We can also observe that, prices faced the resistance near 61.8% retracement of the previous down move (24,111-21,197). Now the next support is its previous pivot low which is around 21,200 levels.”- Bulls Eye. We were very accurate in capturing the move for Hang Seng as it faced the resistance of 61.8% retracement and moved till its previous pivot low of 21200. The index made a low of 21137 and closed near the day’s low which is not a healthy sign. Now to o...

Tech Mahindra: Bollinger Bands and Elliott Wave Counts.

Image
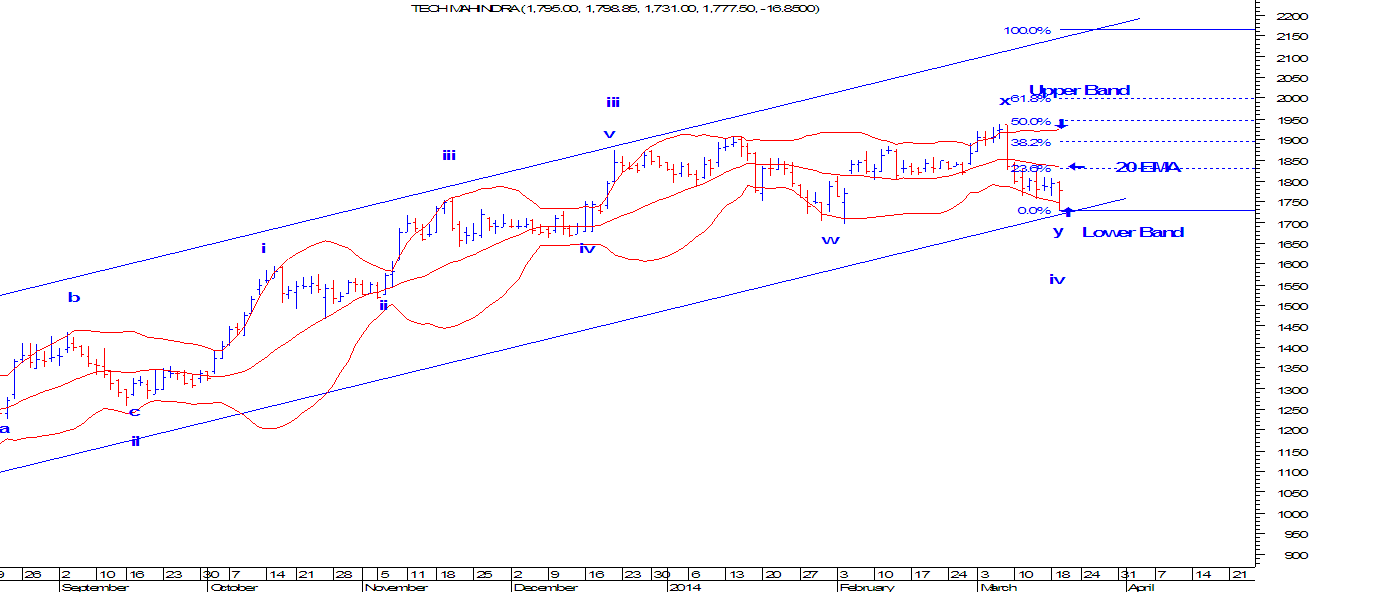
Tech Mahindra, on June 25, 2013 announced the completion of   Mahindra Satyam ’s merger with itself. Post-merger, the new entity becomes the fifth largest IT Company in the country with revenues of $2.7 billion.   Combined entity has a team of 83,000 professionals, servicing 540 customers across 49 countries. It has 15 overseas offices for BPO (business process outsourcing) operations and software development. Its revenue for 2012-13 was put at $2.7 billion (Rs. 16,000 crore). Technically, it is very clear from the below daily chart that the stock is moving up by forming a higher highs and higher lows and it is moving in an upward sloping blue channel which is a healthy sign for this IT stock. On 19 th March 2014, the stock was down but it bounced lately which clearly suggests that there was a buying seen. Using Bollinger Bands has always helped to understand the range of the asset class. These are self adjusting bands and are very helpful in a range bound market. In ...

FTSE 100: Triple Correction and Forecasting

Image
The   FTSE 100 Index , also called   FTSE 100 ,   FTSE , or, informally, the   "footsie"   , is a   share index   of the 100  companies   listed on the London Stock Exchange   with the highest   market capitalization . It is one of the most widely used stock indices and is seen as a gauge of business prosperity for business regulated by   UK company law . The index is maintained by the   FTSE Group , a subsidiary of the   London Stock Exchange Group . The index began on 3 January 1984 at the base level of 1000; the highest value reached to date is 6950.6, on 30 December 1999. After falling during the   financial crisis of 2007-2010   to below 3500 in March 2009, the index recovered to a peak of 6091.33 on 8 February 2011,   fell   under the 5000 mark on the morning of 23 September 2011, but reached 6865.86 at the market close on 24 February 2...

USDINR: Completion of Triangle Pattern

Image
It is believed that USDINR will not move above 63 levels and will consolidate within the range of 60-63 by many analysts, brokers and traders. What is the story behind USDINR? To know the answer we have used Elliott Wave Analysis to know the forthcoming trend. By using this advance technical theory, it has become easy to identify the patterns and its implication. From the daily chart of USDINR we can observe that, prices has been moving in a range of 60-63 from past 5 months which has been very difficult for traders to trade in currency pair as it was moving in a triangle pattern. Triangle pattern occurs in selected waves and cannot be plotted anywhere as per the guidance of R.N Elliott. In a triangle pattern there are 5 legs (a-b-c-d-e) each comprising of 3 (a-b-c) which is a form of corrective pattern. It seems that prices have completed the last leg of triangle pattern and it is now ready to move up. The target for this pattern comes to around 67 levels. In shor...

Nikkei 225 moving in Corrective Pattern and Forecasting.

Image
The Nikkei 225, more commonly called the Nikkei, the Nikkei index, or the Nikkei Stock Average ,is a  stock market index  for the  Tokyo Stock Exchange  (TSE). It has been calculated daily by the  Nihon Keizai Shimbun  (Nikkei) newspaper since 1950. It is a  price-weighted index  (the unit is  yen ), and the components are reviewed once a year. Currently, the Nikkei is the most widely quoted average of Japanese equities, similar to the  Dow Jones Industrial Average . In fact, it was known as the "Nikkei Dow Jones Stock Average" from 1975 to 1985. The Nikkei 225 began to be calculated on September 7, 1950, retroactively calculated back to May 16, 1949. Since January 2010 the index is updated every 15 seconds during trading sessions. The Nikkei 225 Futures, introduced at  Singapore Exchange  (SGX) in 1986,  the Osaka Securities Exchange  (OSE) in 1988,  Chicago Mercantile Exchange...

Hang Seng: Elliott Wave Forecasting

Image
The Hang Seng Index is a freefloat-adjusted market  capitalization-weighted   stock market index  in  Hong Kong . It is used to record and monitor daily changes of the largest companies of the  Hong Kong stock market  and is the main indicator of the overall market performance in Hong Kong. These 48 constituent companies represent about 60% of capitalisation of the Hong Kong Stock Exchange. HSI was started on November 24, 1969, and is currently compiled and maintained by Hang Seng Indexes Company Limited, which is a wholly owned subsidiary of  Hang Seng Bank , one of the largest banks registered and listed in Hong Kong in terms of market capitalisation. It is responsible for compiling, publishing and managing the Hang Seng Index and a range of other stock indexes, such as Hang Seng China Enterprises Index, Hang Seng China AH Index Series, Hang Seng China H-Financials Index, Hang Seng Composite Index Series, Ha...

IDFC: Elliott Wave Counts or Banking License Assurance?

Image
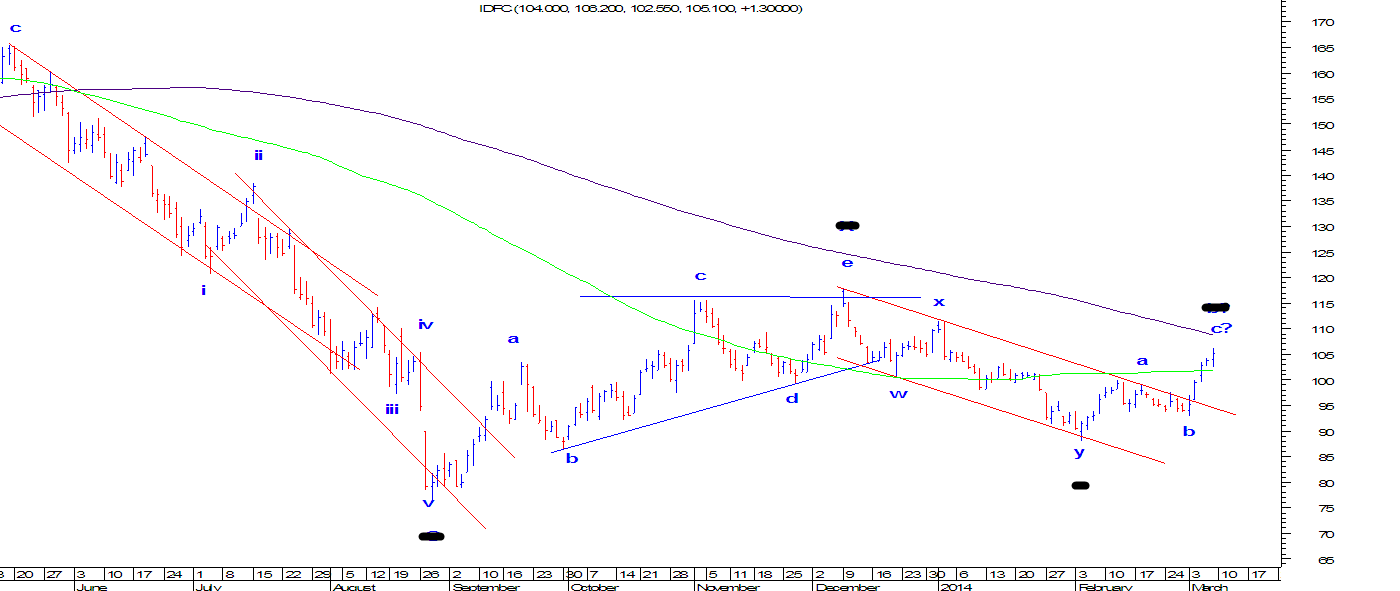
IDFC is been in news in Dalal Street from some time especially when there was an outbreak that IDFC has more chances to get the banking license then the other candidates. Many analysts, brokers, investors and traders are very bullish for this stock. Does news really drive the stock prices? To know the answer we used Elliott Wave analysis to get the objective answer. This advance technical analysis is very useful tool to take proper trading decisions and helps to initiate trade with proper risk/ reward ratio. From the below daily chart we can observe that prices has given a bullish break in the falling red channel which has pushed prices higher till 106 after giving break on 4 th March 2014. Is this breakout going to sustain? Or it will start its down move? We have used Elliott Wave which says that one more leg on the downside is still pending which can come very soon before the up move starts. The reason is after making a high of 117 in the month of December 2013 price...

Punjab National Bank: Elliott Wave Counts, Channelized Move, Time Cycle, Fibonacci Retracements.

Image
Banking stocks has always been in demand especially from past 1 week which has pushed the Banking index till 11947 from 10664 in five trading days. We have covered one of the Banks which fall in this index which is PNB. Punjab National Bank is moving in a down ward sloping channel from past 3 years which clearly suggests that the trend is negative as it is continuously moving below its previous pivot lows as seen the below daily chart. We can also see that prices have arrived near the resistance of the channel which is not a healthy sign for this banking stock. We have used time cycle of 18 days to understand the possible reversal of this stock which comes on 21 st of March 2014. The important observation in time cycle is after every 18 days it makes two bottoms followed by two tops. The 2 bottoms before the making of the top were 24 th February 2014 and 29 th January 2014. We have also used Elliott Wave analysis to find out the termination of the current wave on the...

Reliance Capital: Fibonacci Retracements, Projection and Complex Correction

Image
From the below Daily chart of Reliance Capital one can observe that prices are moving in a range of 390-295. This stock is moving in this 100 pts range from past 11 months and it seems that this is going to continue for further months. Reliance Capital has been in news from some time but it has always underperformed despite of issuing banking license, issuing the banking license is still a myth but the stock started correcting especially after making a high of 407 on 9 th December 2013 when Nifty made a high of 6415, thereafter it started moving down till its lower extreme of the range and made a low of 304 on 28 th February 2014. What is the next move for this ADAG stock? By using Elliott wave Analysis we came to the conclusion that this high beta stock is on the brink to complete its basing formation and can start to outperform very soon. We are aware that prices has given a bullish break in falling red channel pattern which is visible on the charts, we are also awa...