Posts

Showing posts from April, 2014

Nifty: Expanding Diagonal Pattern

Image
                                     Yes, you heard it right and you will see it after reading this article. A diagonal pattern or a wedge pattern occurs in some fixed waves. This pattern forms when there is a massive distribution or accumulation happening. Nifty often forms diagonal patterns and the post implication is hazardous whether its 2008, 2013, 2014 fall all has diagonal pattern forming. Diagonals are of 2 types one is an Ending diagonal and other is a Leading diagonal. In ending diagonal one of the types is also known as Expanding diagonal. The rise from 5933 till 6869 in Nifty was so fast that majority of analysts thought at every peak that Nifty will reverse and it proved them wrong thus making all time high. Also on daily chart it is quite visible that RSI has started exhibiting negative divergence which suggests that upside momentum is slowing down. Is Nifty sending an ...

DJIA (US): Elliott Wave Counts

Image
The   Dow Jones Industrial Average , also called the   Industrial Average , the   Dow Jones , the   Dow Jones Industrial , the   Dow 30 , or simply the   Dow , is a   stock market index , and one of several indices created by   Wall Street Journal editor and   Dow Jones & Company   co-founder   Charles Dow . The   industrial average   was first calculated on May 26, 1896. [1] Currently owned by   S&P Dow Jones Indices , which is majority owned by   McGraw-Hill Financial , it is the most notable of the Dow Averages, of which the first (non-industrial) was first published on February 16, 1885. The averages are named after Dow and one of his business associates, statistician   Edward Jones . It is an index that shows how 30 large   publicly owned   companies based in the   United States   have traded during a   standard trading   session in the   stock market . [3]...

Bovespa (Brazil): Elliott Wave Analysis

Image
The   Bovespa Index   ( Portuguese :   Índice Bovespa ) is an index of about 50   stocks   that are traded on the   São Paulo Stock, Mercantile & Futures Exchange   (Bovespa:   BO lsa de V alores do   E stado de   S ão   PA ulo). The index is composed by a theoretical portfolio with the stocks that accounted for 80% of the volume traded in the last 12 months and that were traded at least on 80% of the   trading days . It's revised quarterly, in order to keep its representativeness of the volume traded and in average the components of Ibovespa represent 70% of the all the stock value traded. IBOVESPA is an accumulation index. Its index number represents the   present value   of a portfolio begun on 2 January 1968, with a starting value of 100 and taking into account share   price increases   plus the reinvestment of all dividends, subscription rights and bonus stocks received. As per Ellio...

Reliance Capital: Anticipated Happened

Image
On 7 th March we anticipated that Reliance Capital will move till 377-380 levels, we had also mentioned that it will take few months to reach this level. Below is the excerpt of this ADAG stock where we had mentioned the target level when the stock was quoting at 329 levels. We are aware that prices has given a bullish break in falling red channel pattern which is visible on the charts, we are also aware that there is a positive divergence which is marked by blue line. All this factors suggests that the trend is changing from negative to positive. We have also used Retracements and Projections to find out the possible target for this stock. Wave b of the second correction has taken the support of 80% Fibonacci retracement of the previous up move (289-407). Which clearly suggests that wave b of the second correction is in flat pattern. By knowing which pattern it has formed now it is easy to forecast the future price for this stock by using Fibonacci projections. By...

Bel 20 (Belgium): Correction after Impulsive move

Image
The BEL20  is the benchmark  stock market index  of  Euronext Brussels . In general, the index consists of a minimum of 10 and a maximum of 20 companies traded at the  Brussels Stock Exchange . Since 20 June 2011, the BEL20 has contained 20 listings. The index was moving in a positive direction forming a higher high and higher low formation but RSI which is a momentum indicator has started exhibiting negative divergence which suggests that momentum on the upside was slowing down. Prices are moving in an upward sloping blue channel and can move down to test the support of the channel which is near 3000 levels. Breach of 3000 levels will infuse further selling pressure. As per wave perspective, prices were moving in an impulse upmove from December 2013 and made 5 wave structure. The high was 3154, thereafter it started moving in a negative direction. The current downmove is corrective in nature. In short, BEL 20 can move down further and can ...

JP Associates: Anticipated Happened

Image
In our previous article dated on 30th March 2014 we had mentioned that, “News always comes after prices have given a breakout and has started moving up which is very difficult for traders and investors to capture. To eradicate this problem it is necessary to use technical analysis and Elliott Wave theory to know the possible reversal before the news arrived. By using Elliott wave theory  one can capture not only the reversal but also can forecast which is been shown in the below daily chart. ” Prices move exactly as anticipated which is shown in the below daily chart

USD British Pound: What's the next trend?

Image
After the recent selloff, this currency pair seems to be moving in the north direction with lot of strength. Whenever, such sideways to positive movements happen after significant fall, one n eed to understand that the asset class is making a basing formation for the next leg. In the below daily chart of US Dollar British Pound, we have also used ADX to measure the trend for this pair along with that we have shown Elliott Wave Counts. We can observe from the chart is, prices were moving precisely in a downward sloping red channel, but there was a bullish breakout in falling channel formation in the month of March 2014 which opens positive possibilities. After that prices came down and took the support of the trend line and have managed to bounce back. Trading in the direction of a strong trend reduces risk and increases profit potential. The average directional index (ADX) is used to determine when price is trending strongly. In many cases, it is the ultimate trend indicator. After al...

Comparison of 2 Indices -reveal the answers for the next trend.

Image
Yes, you heard it right by comparing 2 main indices you can know what will be the next trend for the Indian Equity Markets. By comparing Nifty with Bank Nifty we found out some facts which signal some shocking revelations. Indian Equity Markets has picked up tremendous pace from past 2 months due the major event lined up (election). Now the question arise how far this euphoria sustain? Well many stock market participants are now turned extremely bullish and are coming with targets of 7500-7800 for Nifty. We will take this as a negative signal as when crowd thinks in one way, markets attune to give a different conclusion. Lets come back to the comparison, Nifty has made a all time high of 6776 which was made on 3 rd Of April 2014, but Bank Nifty has not even managed to cross its previous high of 13281 which was made in 2013, this is a classical negative divergence between two indices which suggest that it is implicit to be cautiously positive at current juncture. We...

Australian Securities Exchange (ASX): Elliott Wave Counts and Forecasting

Image
The Australian Securities Exchange (ASX) is Australia's primary  securities exchange . It was created by the merger of the Australian Stock Exchange and the Sydney Futures Exchange in July 2006. Today, ASX has an average daily turnover of $4.685 billion and a market capitalisation of around A$1.4 trillion, making it one of the world's top-10 listed exchange groups, comparable to the  New York Stock Exchange ,  London Stock Exchange  and  Deutsche. Elliott Wave Analysis has always helped to know the forthcoming trend in any asset class and that is why it is world renowned theory. We have applied this theory in ASX to know what is next for this index. Using Elliott Wave and other technical indicators like moving averages, MACD etc with technical tools like channels, retracements helps to know the possible support and resistance levels.  In the below daily chart of ASX, the index is moving up precisely in an upward sloping blue channe...

BHEL: Bearish Breakout and Elliott Wave counts

Image
Capital goods stock has always been in demand as it was the only sector which was outperforming when Nifty was trendless. When Nifty started to pick up momentum Capital Goods stock like BHEL, LT etc crossed its previous pivot highs thus opening up positive possibilities. Recently positive momentum in this sector seems to be slowing down which is not a health sign. We have applied Elliott Wave counts in BHEL to understand the trend in this stock and the possible support using simple technicals. The below excerpt is been picked from our daily research report “The Equity Waves” where we had mentioned that BHEL has given a negative break. As shown in the daily chart of BHEL, prices were moving up with great strength after making a low of 145 in the month of February 2014 which enabled prices to cross its previous high of 181 and made a new high of 202 recently, but from past 3 trading sessions prices are moving down by breaching its previous lows which is not a healthy sign...

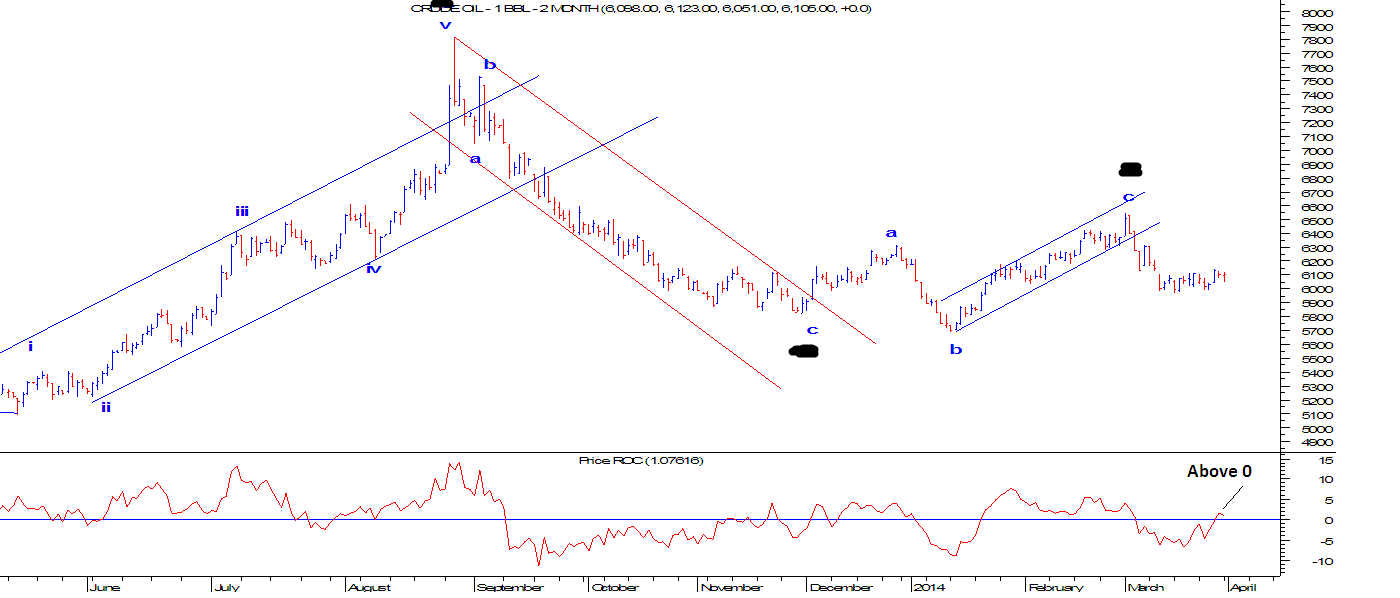
Crude Oil: Trading with Elliott Wave and Price ROC

Image
Crude oil has been very volatile after making low in November 2013. Prices then started to move in a very big range of 6500-5980 levels. Using Elliott wave analysis we came with a view that there is still a big possibility that Crude oil will still respect this range or this range will contract as time passes by. From the below daily chart we have used Elliott Wave analysis to identify the next possible move in Crude oil. As we had mentioned that it is moving in a range, prices has bounced from the lower end of the extreme and can move up from current levels. Again the entire month of March it consolidated in a very stiff range and has probably started the up move. Price ROC has also moved above the equilibrium i.e 0 which opens positive possibilities. As per Elliott wave theory, prices are moving in a corrective form where it has completed ……….. In short, …………………………….