Posts

Showing posts from January, 2015

Bhel: In an expanding Triangle

Image
Triangle is always difficult to trade as prices continue to stay in a same range. However, in expanding triangle, the previous highs and the previous lows are taken out which makes traders confuse about the trend. As per wave theory, Prices are moving in an expanding triangle which have five waves in it (a-b-c-d-e). It seems that the last leg of the expanding triangle is over and the next leg on the downside will resume. Prices can test 265 levels or even lower in near term. In short, BHEL is expected to test the level of 265 or even lower in near term.

USDINR: Ending Diagonal in making

Image
USDINR was moving in a range of 62.90-63.90 for several days. After breaking the level of 62.90, the pair tumbled till 61.38 levels which was marked on 23rd January 2015. The pair has retraced to 38.2% retracement of the previous up move and gave a bearish break in the rising channel formation. However, prices have formed an ending diagonal pattern at the end of the down move thus suggesting the likely termination of the down move. As per wave theory, the rally from 58.22 till 63.90 was a double corrective rally (a-b-c-x-a-b-c). After completing the double corrective pattern, prices then moved down in a simple corrective pattern (a-b-c). It seems that the pair will not see further downfall and it is likely it will reverse from here. The pair can test the level of 62.30-62.40 levels in near term. In short as far as the level of 61.30 is intact on downside, expect prices to move up till 62.30-62.40 levels in near term.

Bharti Airtel: Last Leg of impulse wave

Image
Bharti Airtel is a telecom stock and was in an uptrend from March 2014 till October 2014. The stock then started correcting especially after discontinuing the higher highs and higher low formation and started to form a lower high and a lower low formation which is a negative sign. Prices are moving precisely in a falling red channel and will continue to do so, till it breaches or equals or test its preceding pivot low placed at 335 levels. As per Wave theory, the up move from March 2014 was a corrective move (a-b-c) where in wave c the last leg i.e. wave v was truncated. Currently it is moving down in an impulsive wave (1-2-3-4-5). Recently it completed wave iv at 367 levels and have started its last leg of impulse wave v on downside. Prices can move down till 335-330 levels in near term which will terminate one impulse wave. In short, the bias is firmly negative for Bharti Airtel as it can test the level of 335-330 levels in near term. It is imperative that the level of 367 remai...

Nifty to test 7960 levels (Elliott Wave Analysis)

Image
Nifty made life time high of 8627 levels in the month of December 2014 and thereafter it moved down till 7960 levels, thus eroding 7.73% from the highs. The index then gave a technical bounce and retraced 80% of the previous down move making a lower high at 8445 levels. Today the index snapped 6 day rally and thus gave a reversal bar at the top. A gap down move on the following day will open negative possibilities which can drag prices lower till its previous bottom. RSI has also bounced from the level of 30 and can now resume its down trend. According to wave theory, after marking a high of 8627 levels, prices came down in a corrective pattern and completed wave a, followed by 3 wave structure and completed wave b. Now there is one more leg on the downside which is wave c. According to the projection, wave c can move down till 61.8%n of wave a &b which comes to 8050 levels, breach of this level will then force prices to test the pivot low of 7960 levels. In short, Nifty is i...

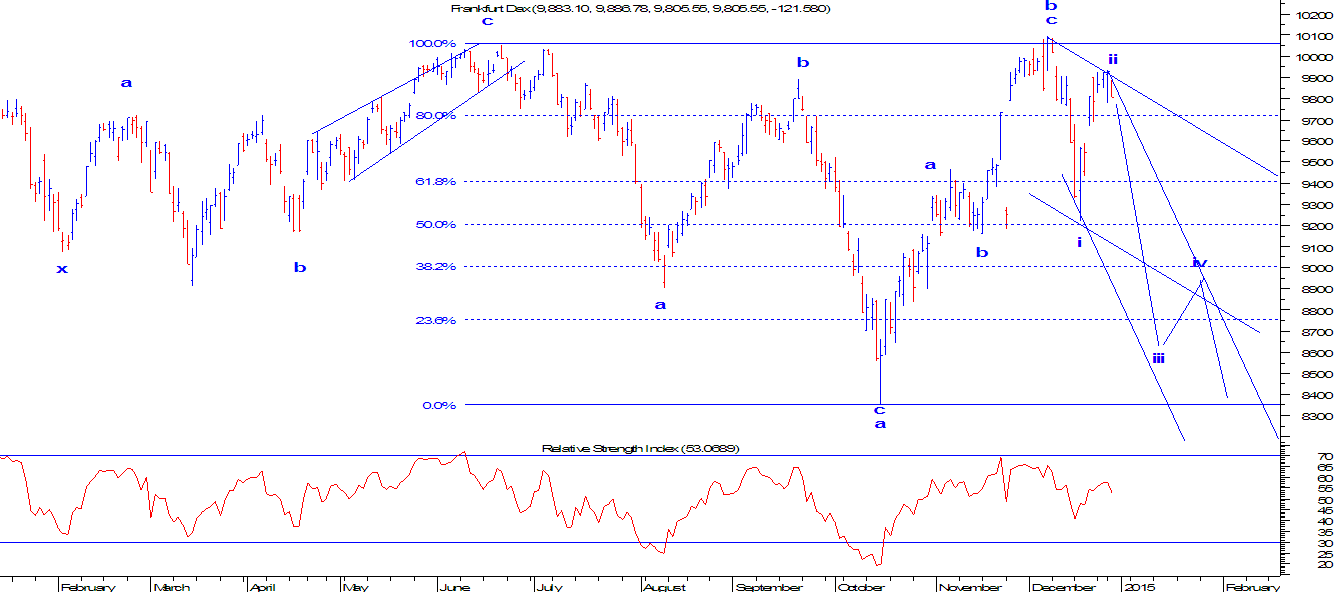
DAX (Germany): In wave c (impulsive)

Image
From the daily chart, DAX is moving in a lower high and a lower low formation and precisely in a down ward sloping channel. This is a negative formation and can make this index slip down to lower levels. Momentum indicator RSI has also reversed from the level of 70 (overbought) and will now test the level of 30 over can even go lower. As per wave theory, the index is moving in an irregular flat pattern (a-b-c), is now moving in a last leg of this pattern which is wave c. Wave c is impulsive in nature and can also be corrective (ending diagonal). Wave c has 5 legs in it and currently it is moving in wave iii.  In an irregular flat pattern prices tend to test the end of wave a or can even go below it. The target of this pattern comes to 8400 levels. In short, German DAX is expected to test the level of 8400 levels in near term and the bias remains firmly negative.