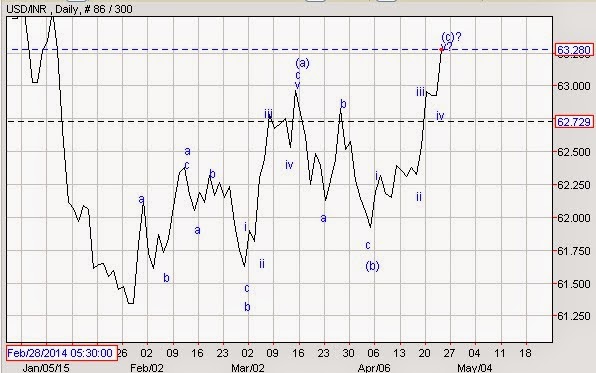
USDINR (3-3-5) Elliott Wave analysis
The pair moved up till 63.30
levels in today’s trading session, but it is important to see how wave counts
are clearly visible on Daily charts. From the lows of February 2015, prices
moved in a 3 wave structure and completed wave a of wave (a), followed by wave
b at 61.50 of wave (a) and then wave c at 63.00 levels where it completed wave
(a). Then it came down in a corrective fashion (a-b-c), where it completed wave
(b). Currently it is moving up crossing the level of 63.00 levels in a 5 wave
structure in which it is probably moving in a last wave i.e wave v of wave (c).
Termination of this last leg of
wave (c) will change the trend from positive to negative and can slip back down
in near term. The next leg on the down side can be corrective or impulsive. It
is imminent that prices will reverse and can test the level of 62.30-62.50
levels in coming month or so.


Comments