Bank Nifty: In an Ending Diagonal pattern
On 21st Oct 2015 major indices like Nifty, Bank Nifty and Sensex were highly volatile after the crash in Chinese market. It is always the structure that forms first followed by news/events (good/bad). In the previous update Nifty in an expanding triangle, upside seems to be capped was mentioned.
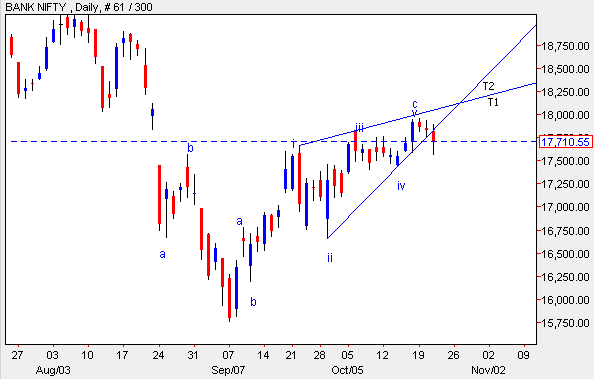
In the below Daily chart of Bank Nifty it is clearly visible, that prices have discontinued the higher highs and higher troughs which is negative sign. RSI has also exhibited negative divergence which suggest that the momentum on the upside will exhaust soon.
As per wave theory, after completing of wave a and wave b of one higher degree wave c was an ending diagonal. Ending diagonal (wedge) have five legs which is a motive wave. After completion of wave v, the post pattern impact was steeper dragging prices below the upward sloping trendline.
In short, any move below 17430 will open negative possibilities for this index which can drag prices near till 15550 levels.
Nifty daily chart
Disclaimer: Please do not circulate this report to Clients and others. The motive for this short term update was to make aware of various patterns and its implications and how it can be used for forecasting various asset classes. Do not trade on this update or take any positions based on the above mentioned view


Comments