Posts

Showing posts from September, 2016

MCX Crude: Still downside intact?

Image
Bechmark Crude oil is failing to move above $49 thus making that level an overhead resistance and the level of $44 as an underlying support. As inventories keep on adding and subtracting prices continue to move in a above mentioned range. MCX Crude from the low of 1805 moved up drastically to the level of 3439 from February to June, thereafter, prices started moving in a counter trend. Counter trend is normally an interruption of main trend. As of now, prices continue to move in this counter trend as the wave are sub-divided. From wave perspective, prices moved in a five wave structure which can be wave 1/a as of now it is moving in either wave 2/b in which wave a was a impulsive and wave b is in a triangle and completing at 61.8% of wave a of wave 2/b. Wave c is due and can move down near to its previous low placed at 2631 which is the end of wave a. In short, the bias is firmly negative for MCX Crude Oil as it is expected to test 2650-2600 levels. However, if prices mov...
MCX Zinc: Ending Diagonal and reversal

Image
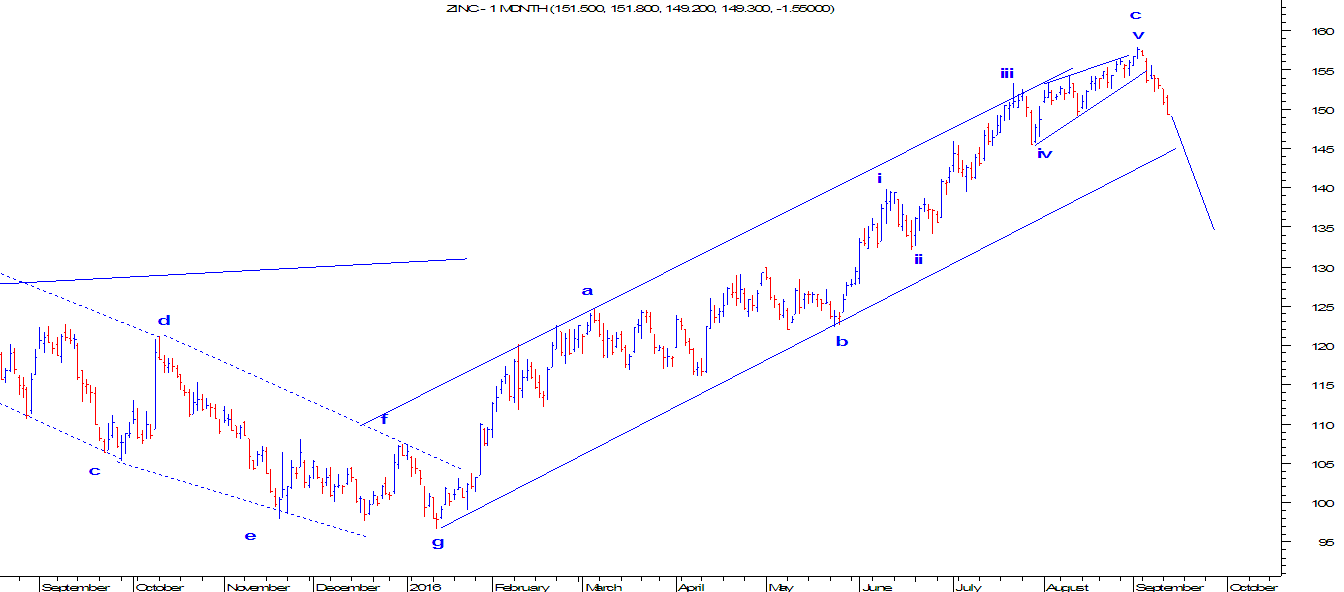
MCX Zinc which surged from the lows of 96.65 and touched till 157.85 levels this month is now going to end its up move and the possibility of a stealth bear trend will start in this metal. As per wave perspective, after making the low of 96.65, prices moved up in a three wave structure (a-b-c) in which wave a completed at 124.50 and wave b which ended in a complex structure at 122.55 levels. Wave c which was an impulse structure in which wave iii was extended and wave v completed by forming a ending diagonal pattern. After completing the ending diagonal pattern, prices are now moving lower. I think the trend has changed and prices are poised to move lower. The immediate support is at 145 levels which is the support of the channel. Break of this channel will infuse further selling pressure in this metal dragging prices lower till 135-138 levels. MCX Zinc Daily chart (1st month continuous contract)

MCX Copper: Change in trend

Image
MCX Copper, from start till date of this year is moving in a range of 300-340 levels. Last expiry the red metal closed at 305 levels and in current series prices are trading above 310 levels. The demand for this metal will increase if the largest importer of the world will start improving. However, technical indicators are giving a clue of a possible trend change. Prices tested the cluster of supports at 305 and moved in a falling channel. The declining channel was broken yesterday when prices closed above 312 levels. Secondly, the peak of 310.65 was taken out at faster time and can possibly be a reversal. However, the metal is not trading above any of the short term moving averages.  As per wave theory, prices might have completed a sideways correction in a form of triangle pattern and has started moving higher which is commonly known as a 'thrust'. The thrust can be an impulse or a corrective but the possibility for prices to move higher is much likely. In short...