MCX Aluminium to shed some recent gains
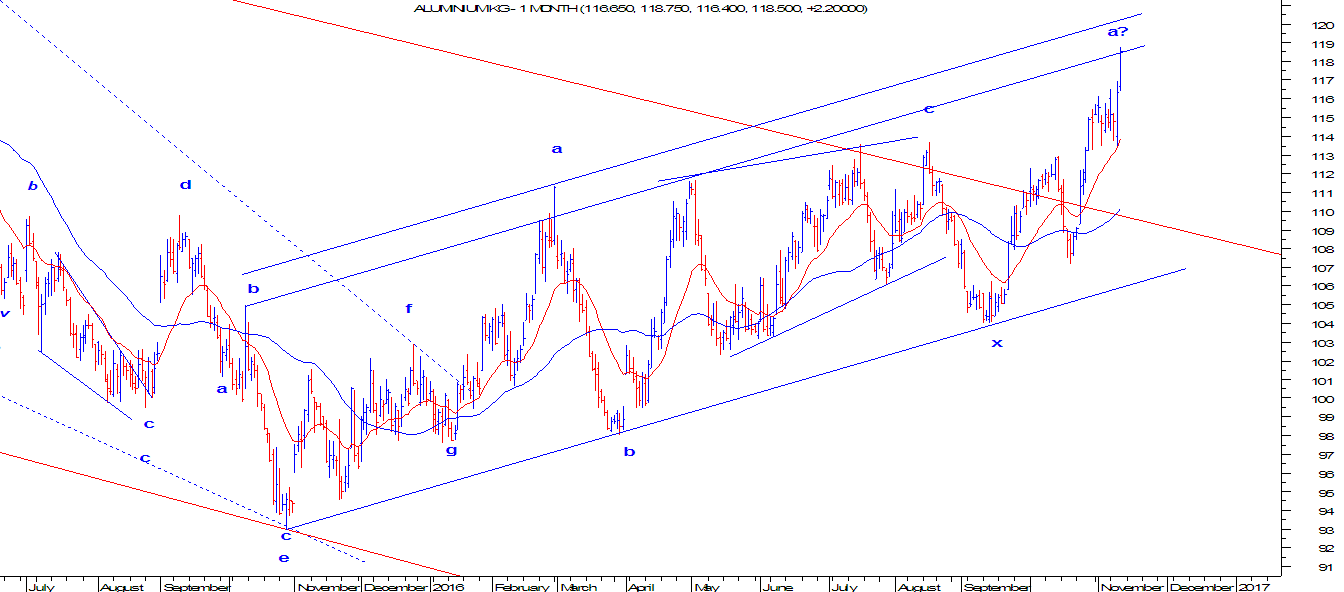
From the below chart of MCX Aluminium, it started its upward journey after forming a bottom in October 2015 and thereafter it is moving precisely in a rising channel formation, this gives an indication that the trend is positive. Moving averages are also showing positive action. However, prices have arrived near the resistance of the channel which can eventually lead to a short term reversal.
As per wave patterns, it is clearly visible that prices are as of now moving in a double correction (a-b-c-x-a-b-c). At current juncture it has completed or in a process to complete wave a of the second correction. Wave a can also exceed till 120 - 121 levels. Following there has to be a good reversal which will start wave b on the downside.
In short, expect prices to move down till 110 levels for short term. The major trend will continue to be positive as far as prices persist in the rising blue channel.


Comments
G M Breweries Ltd
Bharat Petroleum Corp. Ltd
Shoppers Stop Ltd
63 Moons Technologies Ltd