MCX Copper: Elliott Wave analysis and forecasting

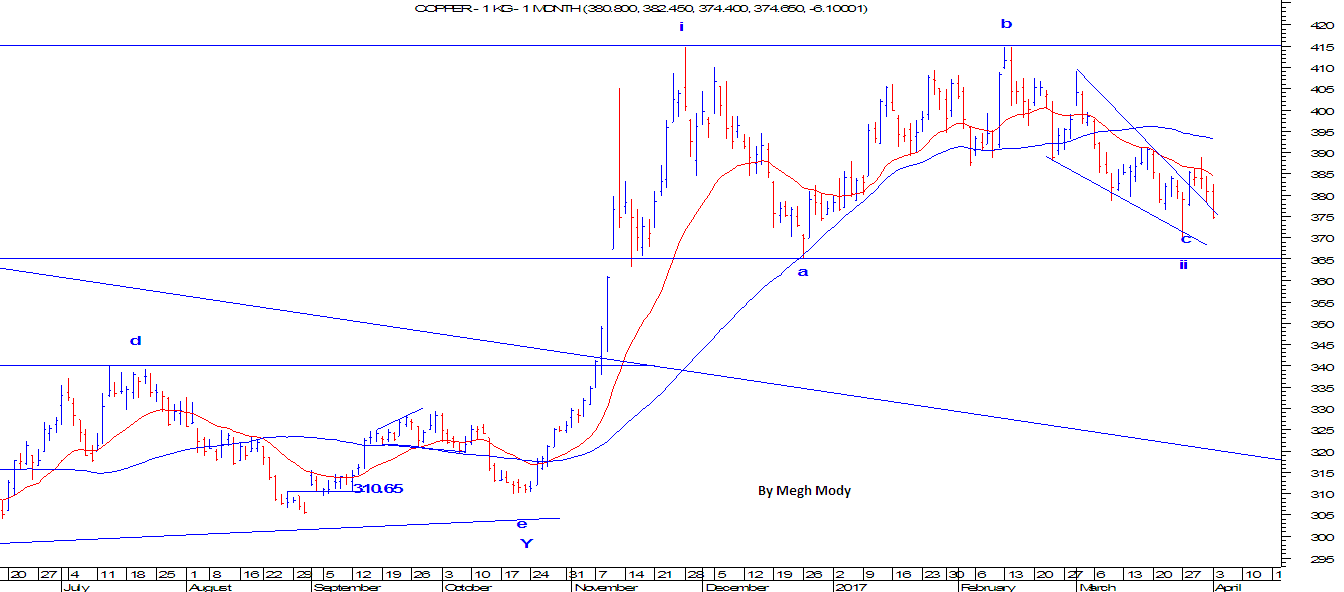
MCX Copper (Continuous Daily chart) MCX Copper last year made a high of 415 and formed a base close to 365 levels, thus giving an indication that the firm downtrend is over and prices are now set to start a positive trend. The downtrend was ended in the month of November 2016 after breaking the downward sloping blue channel. As per Wave theory, after steep rise from 300 to 415 levels, prices are in the making of Flat pattern (3-3-5). As of now it seems that wave c of the flat pattern is over and prices are set to resume the uptrend. However, break of 365 will open other possibilities, which can eventually turn into another pattern. In short, as far as 365 is protected on the downside the bias is positive for MCX Copper as it can surpass 415 levels in near term.