Nifty Bank: Five waves down
Nifty Bank Daily chart
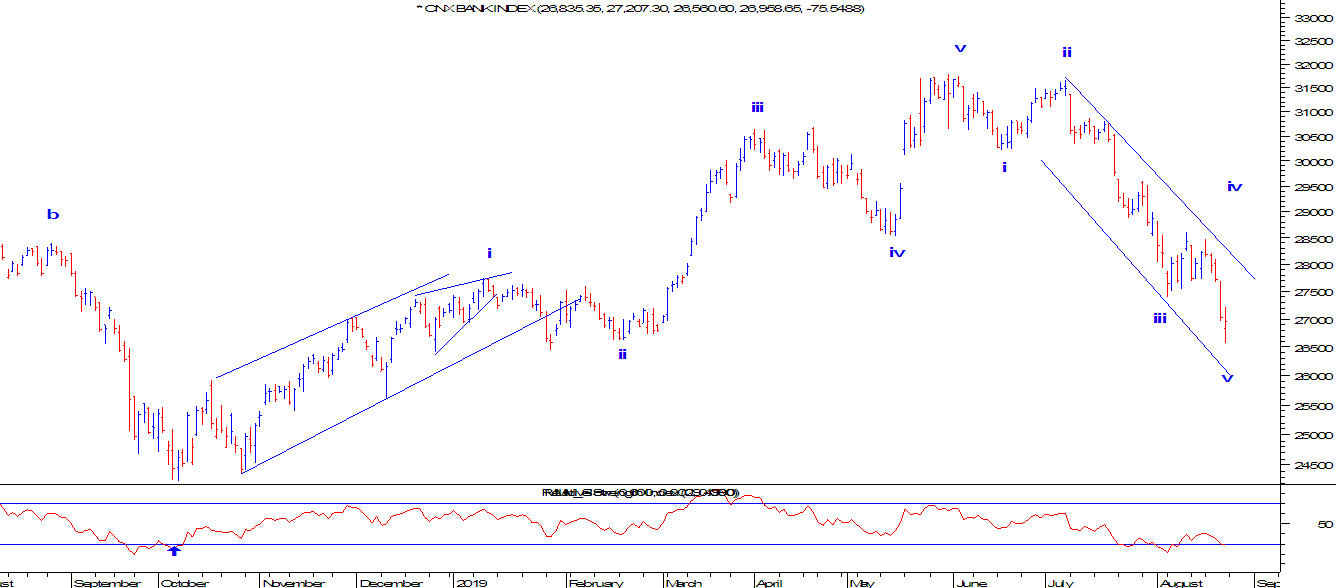
In the above daily chart, Nifty Bank is near support of the falling channel. There are chances for the index to move higher as RSI is exhibiting positive divergence. Also if you observe prices had found support near the horizontal line which was providing support to this index earlier as well.
In the above daily chart, Nifty Bank is near support of the falling channel. There are chances for the index to move higher as RSI is exhibiting positive divergence. Also if you observe prices had found support near the horizontal line which was providing support to this index earlier as well.
As far as 26500 is protected on the downside, it
is likely that the index will move in a positive direction which can test the
previous highs placed close to 28000 levels.
As per wave theory, prices have completed five
waves down, this is an indication that a reversal is due which can soar price
at least 61.8% of the previous fall which comes to 29800 levels. This scenario
is only possible if prices are moving in a zigzag pattern (3-3-5). The second
scenario is, if prices are moving down in an impulse then 38.2% is where wave
ii will be completed which is placed at 28500.
The summation is, prices are likely to give a bounce which can surge price till
28000-28500 over short term. For this level to achieve it is imperative for the
index not to breach 26500.


Comments