Nifty Weekly Analysis on 19th August
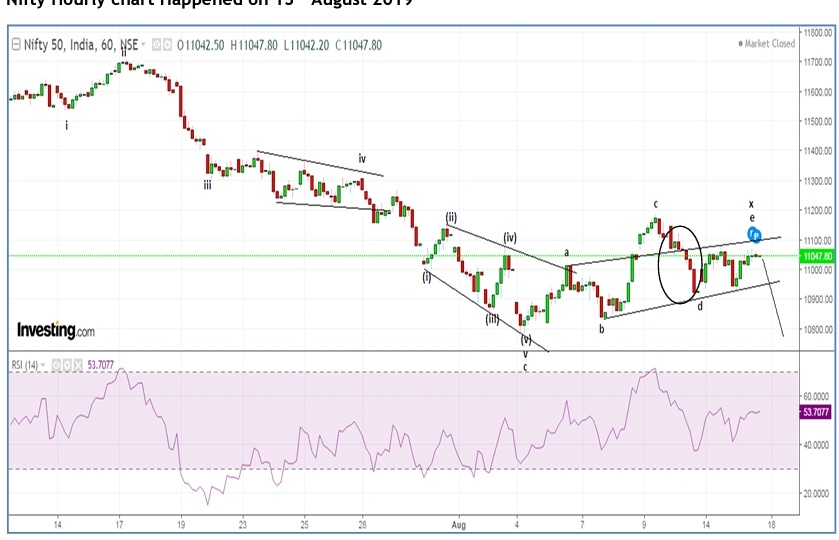
In the above hourly chart, the index moved more in a sideways pattern with no directional move within range of 200-250 points. The support of 10900 and on the upside it faced resistance at 11180-11200 levels. For a directional move to emerge it is important that prices should move above 11200 or break below 10900 decisively.
Wave theory suggests that, prices are moving in a Neutral Triangle pattern which is a Neo Wave pattern. The pattern has five internal legs (a-b-c-d-e) but here wave c will be the longest amongst wave a and wave e. The pattern looks to be completed and prices are set to falter. Any move below 10900 will open further negative possibilities which can drag prices till 10700-10650 levels. The resistance will be at 11180 levels.
The summation of the above three charts is, Nifty will continue to face resistance of 1180-11200.As far as this level is intact, the index is set to dip near till 10700-10650 levels, once 10900 is broken decisively.


Comments