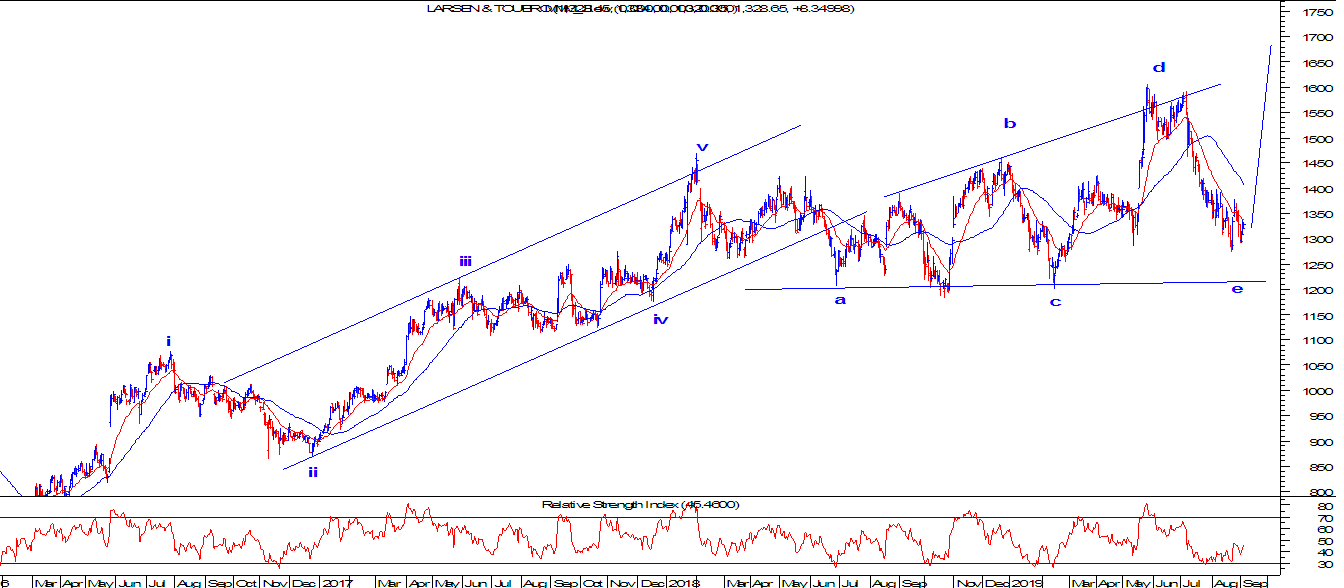
Larsen and Toubro: Inverse Descending Triangle
LT daily chart
Technical Analysis helps you to draw trend lines but at times it is important to use this trend line to draw for patterns. In the above chart I have used to draw an inverse descending triangle, which is visible.
A triangle can also give you pattern target. All this things you can learn in my next Technical Analysis basic session where I will be covering many topics. The details are here:
Webinar. Fees. Tenure
Techical Analysis basic. 15000/-. 2 weeks
Elliott and Neo wave. 10000/-. 2 days
Elliott, Neo n Gann. 20000/-. 5 days


Comments