GBPINR: Elliott Wave Forecast
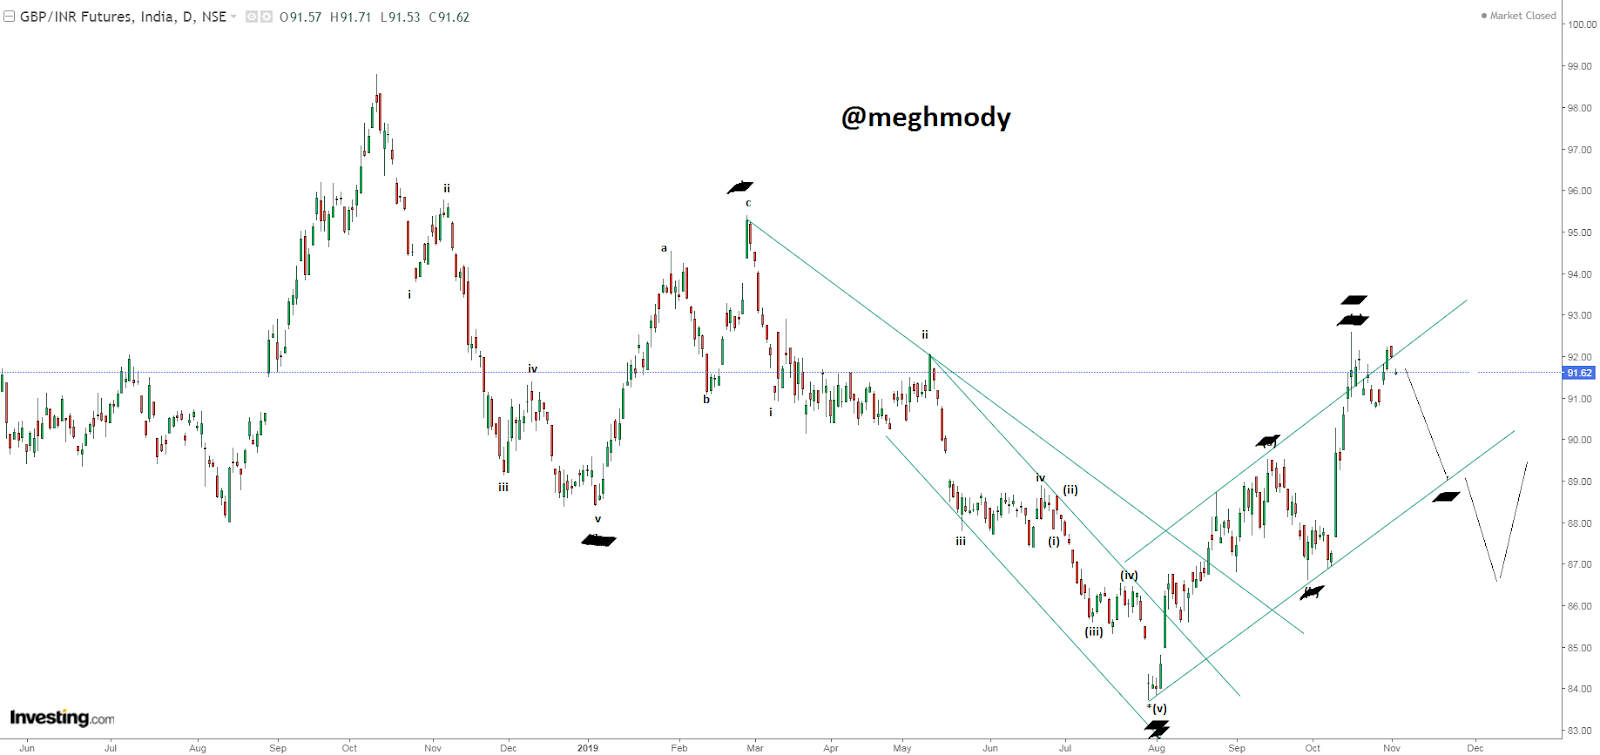
GBPINR Daily Chart
From the above chart it is very clear that prices are moving in a rising channel formation which is a positive sign. As of now it is facing the resistance of the channel, it is likely that it will move down and test the support of the channel. This retracement will also be ....% from the recent up move. This fall which will start in this week will be short lived and prices will be back above 90 levels and test its previous high which is placed at .... levels.
Wave theory say that, GBPINR is moving in a flat pattern where it completed the first correction in a three wave pattern, and now it is moving in wave b which is also corrective in nature in which it has completed wave a and wave b of wave b is set to start. Once that is completed near to .... levels prices will resume the major trend and can move back up till .... levels which is ....% of previous fall. I have hidden the Wave counts and also not mentioned any correction levels and final targets but you can learn from me. The details are here....
Learn Elliott Wave and Neo Wave in my two day paid webinar/classroom training which will be over 12-15 hours session. The fees for the same is 15000/-INR and the course starts fro 16th-17th November. For registration contact :- 9324174580


Comments