EURINR ElliottWave forecast

EURINR on the daily chart is moving down by breaking its previous day low and failing to cross its previous day high (closing basis), this represents that the pair is in stealth downtrend and can even move down further. RSI is below 50 now which means it is in negative terrain.
In hourly chart, prices can move higher from current juncture and will face resistance at 81.20-81.3 levels. Once it will comes close to the hurdle there will be resumption of the major trend which is down. Prices are poised to break its previous low of 80.34 and can falter near till 79.3 to 79 levels. RSI in hourly chart has relieved from oversold terrain and can change direction soon.
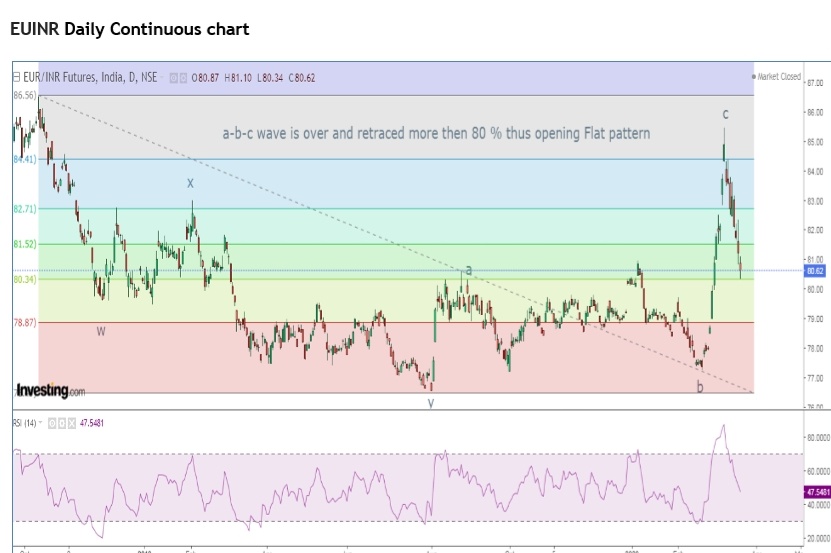
As per wave theory, the pair has started moving down in wave iii which is extended, this will also open wave iv and wave v lower.
The summation is, prices will continue to plunge till 79.3 to 79 levels with resistance placed at 81.2-81.3.


Comments