Posts

Showing posts from June, 2020

Motherson Sumi Anticipated Happened

Image
Motherson Sumi hourly chart Anticipated Motherson Sumi hourly chart Happened In my previous update I had mentioned that, Motherson Sumi if crosses   85 levels will give bullish break which can surge the price near till 100-105." Anticipated Happened I have been clear that it was moving in symmetrical triangle pattern and the breakout is likely to come in the north which it had and surged till 100 and crossed it too. I am sharing my earlier article on Motherson Sumi Link here click on it https://www.marketanalysiswithmeghmody.com/2020/05/motherson-sumi-elliott-wave-forecast.html Elliott and Neo Wave analysis is conducted for 1 month, this is an advance technical course suited for professional traders. Twice a week, 2 hours will be given for theory as well as practical application. The fees for it will be Rs. 10,500/-. Classroom training and webinars both are available. If you reside in Mumbai, classroom training is conducted in Vile Parle near station and Borivali Station. For ...

USDINR Elliott Wave forecast

Image
USDINR daily continuous contract USDINR is now consolidating in a tight range of 76.1 and 75.00, this one rupee range is going to decide the upcoming trend for the currency pair. As per wave theory, prices after completing wave (v) at 77 levels, it moved lower and completed wave a, thereafter it is in the process of forming wave b which seems to be complex correction ans last leg of wave b is on going which can test near to or 76 levels. Once this leg is over, USDINR will plunge near to 74.5 and then 74 levels. The summation is, USDINR is not expected to move above 76.25 and as a result the overhead supply will drag prices near to 74.5-74 levels over short term. Elliott and Neo Wave analysis is conducted for 1 month, this is an advance technical course suited for professional traders. Twice a week, 2 hours will be given for theory as well as practical application. The fees for it will be Rs. 10,500/-. Classroom training and webinars both are available. If you reside in Mumbai, classroo...

Nifty Bank ElliottWave forecast

Image
In the above daily chart, the index has not crossed its previous high as compared to Nifty, this index is likely to cross the level of 21980 levels which will infuse buying pressure soring prices near to its next resistance. Daily RSI is above the center line which is a positive sign for the index. As shown in hourly chart, prices has relieved from the overbought zone so that there can be resumption of the intermediate trend. The next resistance which prices can face is 22600 and if it crosses this level comfortably, then can move till 23000.  As per Wave theory, it can move till 23000 which is 100% of wave a to wave b. This opens wave c higher as wave a and wave b lower is completed and wave c has started. The summation is, the bias is firmly positive for this index as it can move till 22600 followed by 23000 in near term, with support at 20400 levels. Elliott and Neo Wave analysis is conducted for 1 month, this is an advance technical course suited for professional traders. Twi...

MCX Gold Elliott Wave forecast

Image
As per hourly chart, prices are moving down by breaking its previous low which is a negative sign. It is possible that it will break the level of 44750 which will infuse selling pressure dragging prices near till 43000. From Wave theory, Gold might have completed wave b of wave iv and wave c lower is on the brink which can drag till 43000 levels. The summation is, prices are all set to crack in near term with support at 43000 once the level of 44750 is broken. Elliott and Neo Wave analysis is conducted for 1 month, this is an advance technical course suited for professional traders. Twice a week, 2 hours will be given for theory as well as practical application. The fees for it will be Rs. 10,500/-. Classroom training and webinars both are available. If you reside in Mumbai, classroom training is conducted in Vile Parle near station and Borivali Station. For inquiry and registration call +919324174580.

Axis Bank ElliottWave forecast

Image
As per hourly chart, the banking stock has given fresh bullish break in a falling channel which is a positive sign. As of now it is above the falling trend line which is now acting as a support, earlier it was a resistance (polarity reversal). RSI is now moving higher from current levels. From wave perspective, prices are moving in wave c which is impulse in nature after completing wave a and wave b. In wave c it has completed wave i and wave ii and now it will start wave iii higher. The summation is Axis Bank is all set to soar till 480 levels with support placed at 375 levels. Elliott and Neo Wave analysis is conducted for 1 month, this is an advance technical course suited for professional traders. Twice a week, 2 hours will be given for theory as well as practical application. The fees for it will be Rs. 10,500/-. Classroom training and webinars both are available. If you reside in Mumbai, classroom training is conducted in Vile Parle near station and Borivali Station. For inquiry ...

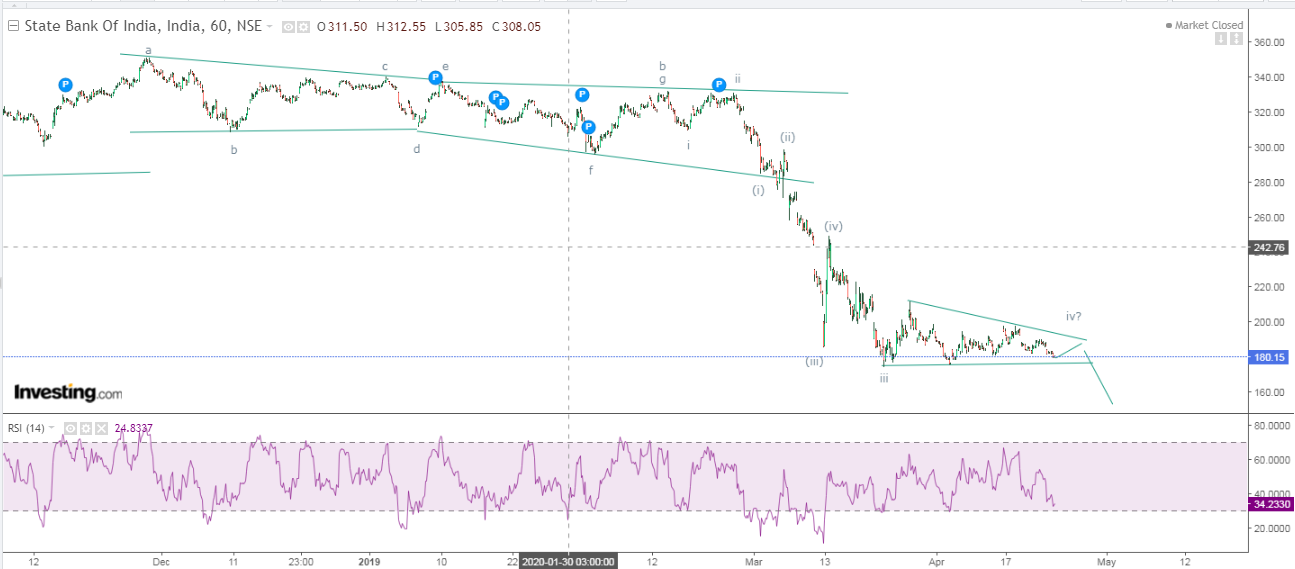
SBI: Anticipated Happened and Elliott Wave forecast

Image
SBI hourly chart anticipated on 25th April 2020 SBI hourly chart happened In my previous update I had mentioned that," SBI will move down till 165 if the level of 175 is broken." I had also mentioned that triangle is in making which is exactly what has happened. Now it seems that prices are all set to surge as wave c is completed with five sub-waves in it after triangle pattern. Now fresh leg has started which will soar price till 175-180 levels over short term. Elliott and Neo Wave analysis is conducted for 1 month, this is an advance technical course suited for professional traders. Twice a week, 2 hours will be given for theory as well as practical application. The fees for it will be Rs. 10,500/-. Classroom training and webinars both are available. If you reside in Mumbai, classroom training is conducted in Vile Parle near station and Borivali Station. For inquiry and registration call +919324174580.