Nifty Elliott Wave Analyis (Time Analysis with Price)
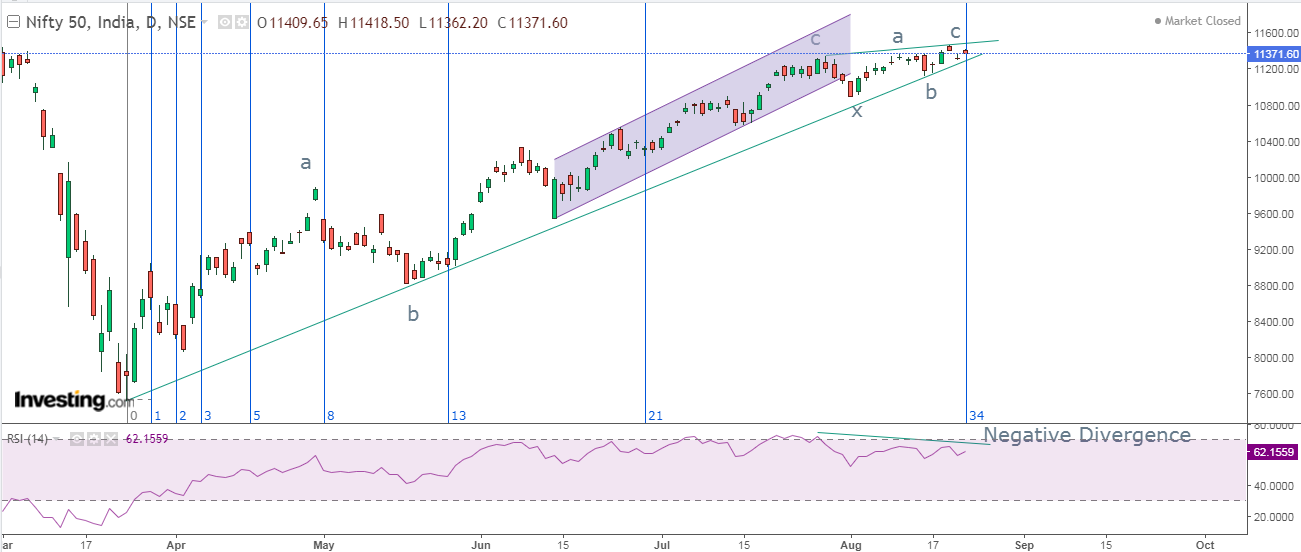
Nifty Daily chart
Nifty hourly chart
In
the daily chart, prices still continue to move in a higher highs and higher
lows, but what is more worrying is the candles which are now becoming smaller
and smaller indicating lack of positive momentum. In my previous article I had
mentioned that Nifty can go till 11600 but it will negate, though it made a
high of 11460 but now there are more signs of reversal occurring on the chart.
The first and foremost is a negative divergence exhibiting on RSI where prices
are making new high but RSI is not.
Fibonacci Time zone which I have applied on
daily chart (vertical lines) indicate that there is a high possibility of
reversal, as and when index encloses to that time zone it has shown a reversal
or a continuation in price action.
As
shown in hourly chart, the benchmark is still above the rising trend line, it
is advisable to short the index once price trade below this trend line which is
below 11220 levels. Once this level is breached, prices will discontinue higher
highs and higher lows which will change the trend from positive to negative.
Also there is a high possibility for prices to remain in a range in coming week
but a correction will not be ignored.
As
per Wave theory, after completing second correction which is wave a-b-c after
wave x, prices are possibly moving in a flat pattern which can be converted in
irregular flat pattern as well. A three wave structure is seen in this pattern
where it has completed wave a and currently moving in wave b which can test its
previous high of 11460 and then wave c lower.
The
summation is Nifty can re-test 11460 levels with a capping at 11520, on the
downside it can move near till 11200. The benchmark is in transition phase so
it is better to remain cautiously positive in the index.
Education
Learn
Technical Analysis in our 4 month course to help you to identify better trade
setups. This course will be conducted every twice in a week for around 2 hours.
This theory can be applied on all free floating markets. In this course learn
from basic to advance and the fees for the same will be Rs. 12,000/-
Elliott
and Neo Wave analysis is conducted for 1 month, this is an advance technical
course suited for professional traders. Twice a week, 2 hours will be given for
theory as well as practical application. The fees for it will be Rs. 10,500/-.
Classroom
training and webinars both are available. If you reside in Mumbai, classroom
training is conducted in Vile Parle near station and Borivali Station. For
inquiry and registration call +919324174580.


Comments
Check below links and get useful information.
Midcaps
Mutual Fund