Axis Bank Elliott Wave Analysis
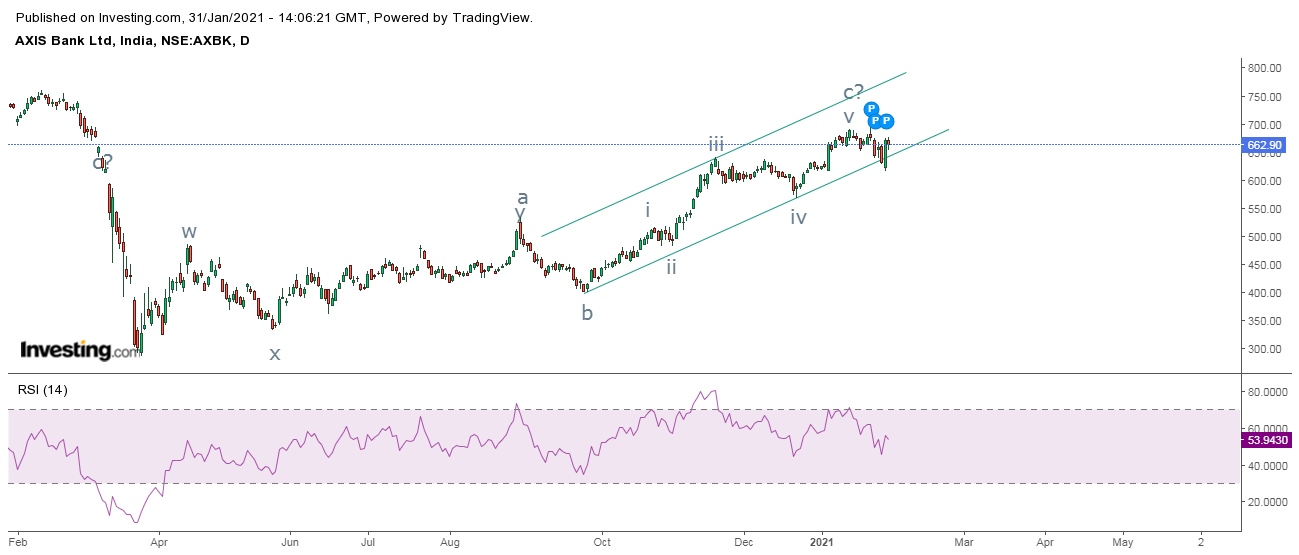
Axis Bank daily chart
Axis Ban hourly chartAs per daily
chart, the banking stock, tried to break the rising trend line support but
quickly picked up momentum and turned higher. Daily RSI have taken support from
its previous low marked by horizontal black line, indicating that prices might
jump from current levels.
From hourly
chart, there is no discontinuation of higher high and higher lows and so as far
as prices persists in the rising channel the bias is positive and can rest till
its previous high or near to it. Prices can travel till 685-689 levels over
short term with support at 648 (closing basis). There is still some vacuum for
RSI to reach till overbought terrain.
As per Wave
theory, the stock is moving in wave b which looks to be a flat, irregular flat
or running flat pattern. It will depend how wave b will move or much percent
till will retrace of wave b as compared to wave a of wave b. At present till
has retraced 80% of wave a of wave b and can move till 100% or even 123.6%
going ahead.
The
summation is Axis Bank is supposed to travel till 685-689 levels over short
term with support at 648 (closing basis).
Education
Learn
Technical Analysis in our 4 month course to help you to identify better trade
setups. This course will be conducted every twice in a week for around 2 hours.
This theory can be applied on all free floating markets. In this course learn
from basic to advance and the fees for the same will be Rs. 12,000/-
Elliott
and Neo Wave analysis is conducted for 1 month, this is an advance technical
course suited for professional traders. Twice a week, 2 hours will be given for
theory as well as practical application. The fees for it will be Rs. 10,500/-.
Classroom
training and webinars both are available. If you reside in Mumbai, classroom
training is conducted in Vile Parle near station and Borivli Station. For
inquiry and registration call +919324174580.


Comments