Coal India Elliott Wave Analysis
Coal India daily chart
Coal India hourly chart
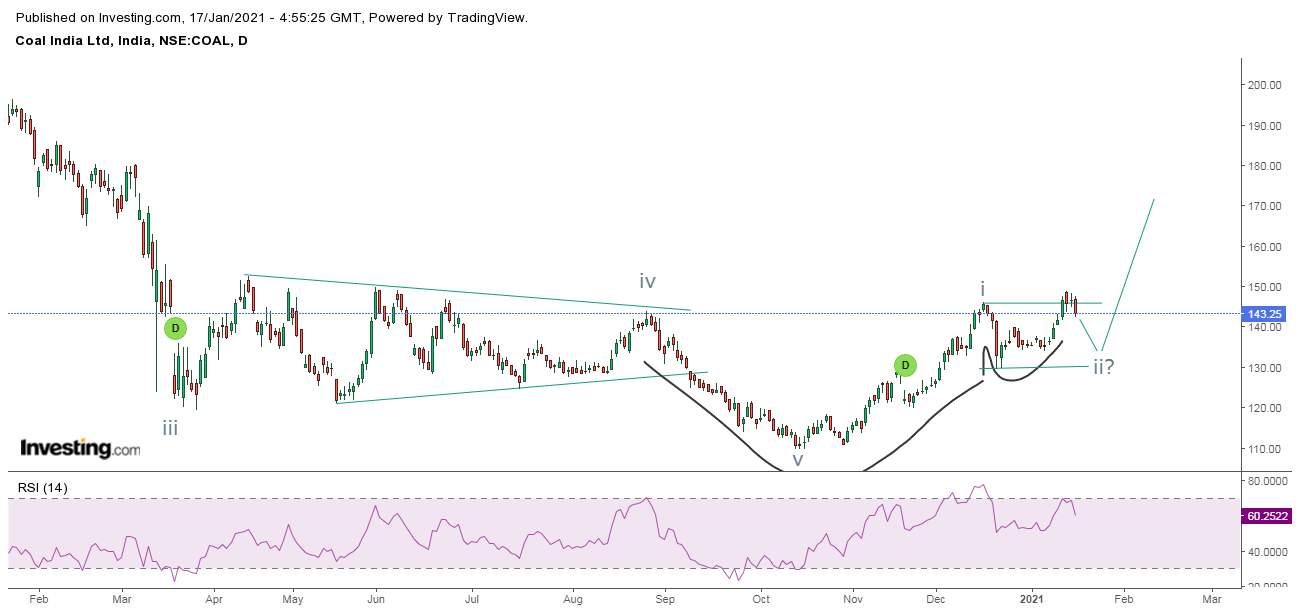
As per daily
chart, the stock is under accumulation phase and has formed a rounding bottom
or a bullish cup and handle pattern. However, there is still a need to get a
bullish breakout, which can only be obtained once it trades above 145 levels. A
sustainable move above 145 will soar prices till 180 as per the target of the
pattern. RSI has relieved from the overbought terrain and can pick up momentum.
From hourly
chart, prices are consolidating in a range marked by two horizontal lines. The
immediate support is at 140 levels, break of 140 can drag prices further till
136 levels. Also after this downfall, the stock is poised to move higher from
there near till 160 followed by 180 levels. RSI is near to the oversold
terrain.
As per Wave
theory, the stock has completed wave i and it on the brink to complete wave ii
which can be a regular flat pattern, where wave c will fail and then it will
start wave iii on the upside.
The
summation is Coal India can find support in the zone of 140-136 which can be
utilized as a buying opportunity for the level of 160- 180 levels over short to
medium term.
Education
Learn
Technical Analysis in our 4 month course to help you to identify better trade
setups. This course will be conducted every twice in a week for around 2 hours.
This theory can be applied on all free floating markets. In this course learn
from basic to advance and the fees for the same will be Rs. 12,000/-
Elliott
and Neo Wave analysis is conducted for 1 month, this is an advance technical
course suited for professional traders. Twice a week, 2 hours will be given for
theory as well as practical application. The fees for it will be Rs. 10,500/-.
Classroom
training and webinars both are available. If you reside in Mumbai, classroom
training is conducted in Vile Parle near station and Borivli Station. For
inquiry and registration call +919324174580.


Comments