SBIN Anticipated Happened
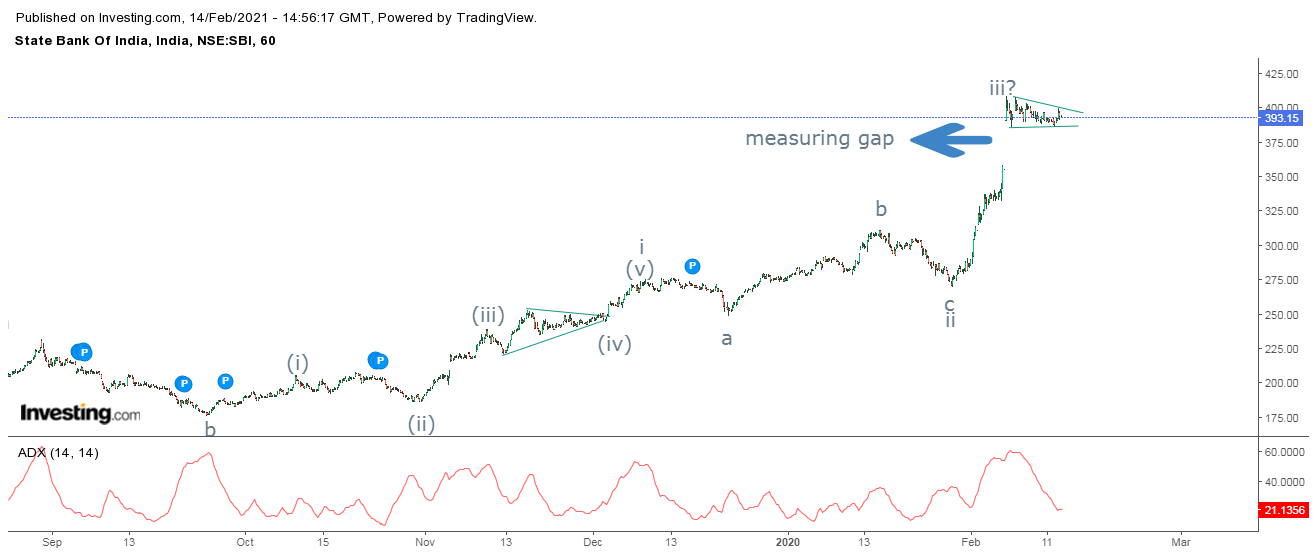
SBIN hourly chart anticipated on 14th Feb 2021
SBIN hourly chart happened on 18th Feb 2021
In my previous update on SBIN dated 14th February, I had mentioned that, "SBIN is set to conquer 417-420 levels provided the level of 386 is intact on the downside. Any move below 386 will negate the triangle pattern, and it will open other corrective patterns."- Anticipated Happened.
Prices marked a high of 429 levels, thereby achieving my mentioned level of 417-420 levels. Here is the link of my previous article of SBIN dated 14th Feb. Click on the link
https://www.marketanalysiswithmeghmody.com/2021/02/sbin-elliott-wave-analysis.html
It is difficult to place manual wave counts without knowing the theory. You can learn the theory along with practical applications of Wave Analysis. It will be a one month webinar and the details are mentioned below.
Learn Technical Analysis in our 4 month course to help you to identify better trade setups. This course will be conducted every twice in a week for around 2 hours. This theory can be applied on all free floating markets. In this course learn from basic to advance and the fees for the same will be Rs. 12,000/-
Elliott and Neo Wave analysis is conducted for 1 month, this is an advance technical course suited for professional traders. Twice a week, 2 hours will be given for theory as well as practical application. The fees for it will be Rs. 10,500/-.
Classroom training and webinars both are available. If you reside in Mumbai, classroom training is conducted in Vile Parle near station and Borivli Station. For inquiry and registration call +919324174580.


Comments