Wipro Elliott Wave Analysis
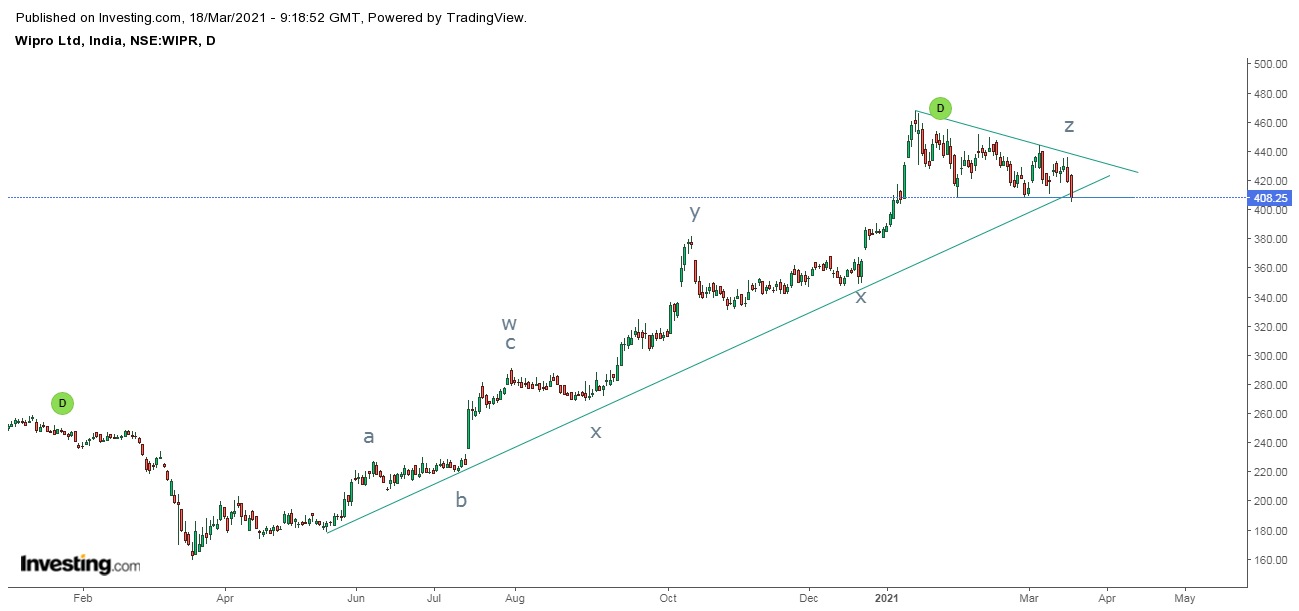
Wipro daily chart
From the above chart, the IT stock which was persisting above the rising trend line has given a bearish break by trading below it. Also to embellish, prices have discontinued the higher highs and higher lows formation which is making the formation weak.
As per Wave theory, prices are moving in a complex correction (w-x-y-x-z) where in wave z there is a descending triangle pattern. The breakout of the triangle is bearish thereby confirming a topping process and also end of wave z.
Now the stock can plunge near to about 370 levels over short term with immediate resistance at 416 levels.
Elliott Wave is difficult to practice, but you can learn with me the theory along with its practical applications. The one month webinar is going to start from April, the details are mentioned below.
Learn Technical Analysis in our 4 month course to help you to identify better trade setups. This course will be conducted every twice in a week for around 2 hours. This theory can be applied on all free floating markets. In this course learn from basic to advance and the fees for the same will be Rs. 12,000/-
Elliott and Neo Wave analysis is conducted for 1 month, this is an advance technical course suited for professional traders. Twice a week, 2 hours will be given for theory as well as practical application. The fees for it will be Rs. 10,500/-.
Classroom training and webinars both are available. If you reside in Mumbai, classroom training is conducted in Vile Parle near station and Borivli Station. For inquiry and registration call +919324174580.


Comments