Posts

Showing posts from June, 2021

Tata Steel Elliott Wave Analysis

Image
 Tata Steel daily chart From the above chart, it is very clear that the tend is in stealth uptrend, also if you see the trend lines which I have dawn keeps becoming steeper, giving an indication that the angle of the trend is becoming steeper and steeper. As far as prices continue to form higher highs and higher lows and remains above the trend line support, prices will continue to move in North. Also there is a trend line bullish break recently which can help short term traders to make some quick money. Wave theory suggests that, prices are moving in wave v in which wave (iii) is extended and in which wave 5 is on the brink to start. For short term prices can reach till 1250-1280 levels in form of wave 5. The summation is Tata steel is positively poised and can move higher from current levels and can test 1250 levels followed by 1280 levels over short term.

MCX Nickel Re-visited

Image
 MCX Nickel daily continuous chart anticipated on 13th June 2021 MCX Nickel daily continuous chart happened on 28th June 2021 In my previous update on MCX Nickel, I had mentioned that, "  Prices are all set to test its resistance which is placed at 1400-1420 levels over short term with support placed at 1270 on closing basis." Prices today surpassed 1400 levels, the above chart is of July contract which will eventually test that level as well, thus - Anticipated Happened. I will monitor the future action of price and will update on timely basis, till then you can view my previous article on MCX Nickel by clicking on the link here https://www.marketanalysiswithmeghmody.com/2021/06/mcx-nickel-elliott-wave-analysis-and.html

Canara Bank Elliott Wave Analysis

Image
 Canara bank daily chart As seen in the daily chart, prices have completed the bullish cup and handle pattern. There is a bullish break well above the horizontal trend line and it is now whipsawing that level.  At current juncture it is moving in a range of 175-155 levels. As far as prices persists in this range, no trending move is expected soon. The bullish break will only happen above 175 which can soar prices in near future. On the upside this banking stock can reach till 210-215 levels over short to medium term, which happens to be the pattern target. RSI is also above the center line which is a positive sign. As per the pattern the stop loss should be at 104.4 levels. From Waves perspective, prices have completed wave i and possibly wave ii, which now opens wave iii higher. In wave iii it has likely completed wave (i) and (wave (ii) so wave (iii) of wave iii is on the  brink to start followed by wave (iv) and wave (v) which will complete wave iii. The summation is p...

MCX Crude Oil Elliott Wave Analysis (Impulse Wave)

Image
 MCX Crude Oil daily continuous chart From the above daily chart, prices are moving in a higher highs and higher lows without breaking its previous higher bottom. However, RSI is in overbought zone and can possibly relieve from this zone, but it is also observed that, it can remain in this zone for day or even weeks. As per Elliott Wave Analysis, prices are moving in an impulse wave in which it has completed wave i-ii-iii and wave iv. It is currently moving in wave v which looks to be extended, in which it is moving in wave (iii), once it is over it will start counter wave (iv) and then cross its previous top to complete wave (v) of wave v. The summation is prices are positively poised and can make a new high going ahead, the downside support is at 5150-5180 zone on the upside, prices can test 5800-5830 levels over medium term.

GBPINR Anticipated Happened and Elliott Wave Analysis

Image
GBPINR hourly continuous chart anticipated on 24th May 2021  GBPINR hourly continuous chart happened on 21st June 2021 In my previous update on GBPINR I had mentioned that Prices can move lower and test 102.5 levels in form of wave c of a triangle.  The pair dipped below 102.5 on 21st June 2021 thereby achieving my level- Anticipated Happened Here is the link of my previous article on GBPINR, click on the link https://www.marketanalysiswithmeghmody.com/2021/05/gbpinr-elliott-wave-analysis-triangle.html Now if you see closely there is a falling trend line breakout which opens positive possibilities, also there is a BOE meet outcome today which can drive the price of the pair higher. July contract, prices are quoting at 103.9 and can move higher towards 105 levels over short term.

Shiba Inu Elliott Wave Analysis

Image
Shiba Inu hourly chart As seen in the hourly chart, the crypto currency is moving in an accumulation pattern and can move higher from current levels once the level of $0.00000876 is taken out decisively. The mentioned level is the breakout level of an inverse head and shoulder pattern. Also as per Wave theory, prices are moving in a ending diagonal pattern where it has completed all five legs internally and can move higher from here as there is a clear bullish breakout. The summation is prices are likely to test $0.00001263 over short term, once the level of $0.00000876 is surpassed decisively.

Nifty Elliott Wave Analysis

Image
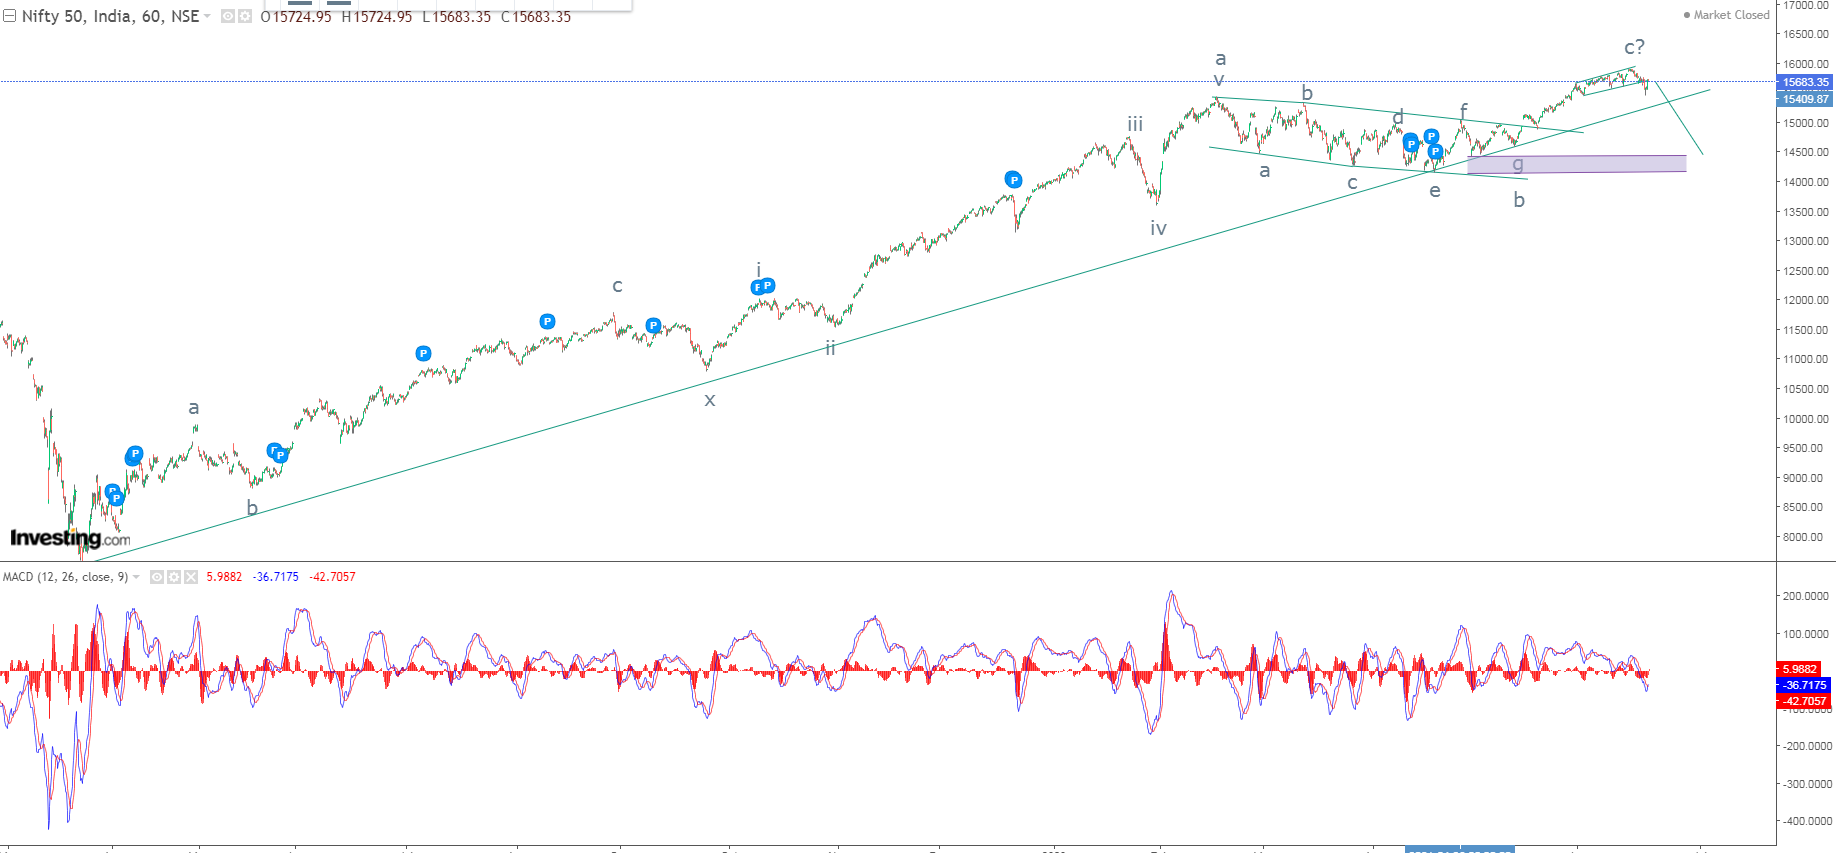
 Nifty hourly chart From the above hourly chart of Nifty, it is very clear that prices are moving in a higher highs and higher lows and prices are persisting above the rising trend line. However, this trend line is not going to hold for long and can be broken in coming trading days. Buy applying MACD, the oscillator is below the center line which is 0, this means that it is showing a negative sign. Also the previous support of the MACD which has tested several times is placed at -136 levels. As per Wave theory, prices are moving in a double correction where wave c of second correction is either ended or on the brink to end, but in wave c of second correction prices have formed expanding diagonal pattern and has given a bearish break and has also re-tested the resistance of the pattern which was earlier acting as a support. The summation is, Nifty is all set to nose dive towards 14500 levels as far as the level of 15900 is intact on the upside.

Tata Motors Anticipated Happened

Image
 Tata Motors hourly chart anticipated on 5th June 2021 Tata Motors hourly chart anticipated happened on 15th June 2021 In my previous article dated on 5th June 2021, I had mentioned that , " Tata Motors is expected to cross 360 levels over short to medium term as far as 311 is protected on the lower side . " Prices surpassed 360 levels by marking a high of 360.75 thereby achieving my level - Anticipated Happened. Tata Motors is either moving in a-b-c correction or it is moving in an impulse wave of wave a of second correction post wave x, this is a concern I have raised in my previous article, in both the cases prices were expected to go up. Here is the link of my previous article https://www.marketanalysiswithmeghmody.com/2021/06/tata-motors-elliott-wave-analysis.html I will continue to monitor the movement in this stock and keep you all updated.

MCX Nickel Elliott Wave Analysis and Technical Analysis

Image
 MCX Nickel daily continuous chart As shown in the above daily chart, prices are moving in a higher highs and higher lows and can move higher from current levels to test the resistance of the rising channel as the positive formation is intact. Daily RSI has sill vacuum to move inside the overbought terrain. From Waves perspective, prices are moving in wave b or a new wave pattern. So as per the former analysis prices are expected to move in wave c which can lead it till 1400-1420 levels. If it is as per the latter analysis then it is likely to cross its previous high. The summation is prices are all set to test its resistance which is placed at 1400-1420 levels over short term with support placed at 1270 on closing basis.

USDINR Elliott Wave Analysis and Keltner Channels

Image
 USDINR daily continuous chart From the above USDINR daily chart, it is clear that prices have given a bullish break in falling channel and can continue to move higher. However, here in this case there was a throwback by prices where it re-tested the upper falling trend line which was earlier acting as a resistance, now as a support (role reversal). At present it is trading above the trend line which is an indication that the bullish break is still intact and prices are poised to move higher going ahead. I have opened a possibility of a range where prices are moving in, the two horizontal lines are the extremes. It recently tested the lower extreme and can move higher from here to test the upper. This also opens the possibility of double bottom and the peak will be at 75.5 which when crossed will open further positive possibilities. By applying Keltner channels it is to be observed that whenever prices move below the lower channel and then re-enters, prices  make volatile move...

MCX Nat Gas reversal pattern and Elliott Wave Analysis

Image
 MCX Nat Gas daily chart From the above daily chart, it is very clear that prices are moving in a positive direction after completion of reversal pattern. Once the pattern was completed, prices continue to move in a sideways direction which was further converted into possible reversal pattern. Lets understand the reversal pattern first. The rounding bottom which took enough time to form with reasonable low volumes and once the resistance was taken out, prices move up with more than average volumes. After that a possible reversal triangle is in making which once completed will decide the direction of this counter. On Waves perspective, prices are moving in (a-b-c) pattern where wave a was a corrective structure followed by wave b in a triangle and once completed wave c will open up higher. The summation is prices can test 200 levels over short term which can drag prices lower, buying opportunity can be expected at these levels which can soar prices towards   300 to 315 lev...

Ripple (XRP/USD) Elliott Wave Analysis

Image
 Ripple (XRP/USD) daily chart As shown in the daily chart, prices are moving in a positive formation and it is above the rising trend line which can soar prices going ahead. For prices to continue to move up, it is imperative that the level of $0.40 is protected on the downside. By doing so, there will be break of its previous higher low thus changing the positive formation. Daily RSI is changing the direction from negative to positive and has reversed from the oversold threshold. As per Wave theory, prices are in a (a-b-c) pattern, in which it has completed wave a and wave b and has completed wave i of wave c. It is on the verge to complete wave ii which will open wave iii higher and can test $2.45 which is 100% of wave i and if it is extended then it can move till $3.86. The summation is Ripple (XRP/USD) is set to move higher near to $2.45 over short to medium term, sustainable move above mentioned level can surge till $3.86 as far as $0.4 is intact. Education Learn Techn...

MCX Gold Elliott Wave Analysis and Inverse Cup and Handle pattern

Image
 MCX Gold daily continuous chart MCX Gold hourly continuous chart As shown in the above daily chart of MCX Gold, prices have given a fresh breakout from the falling trend line and it is above the horizontal line which also completes the bullish cup and handle pattern. During the breakout, prices were accompanied by above average volume which is a positive sign and it is now clear that prices will move in a positive direction from here as far as all the important supports are intact. Prices can continue to move in a sideways pattern due to fewer vacuums for RSI. By seeing hourly chart, prices are persisting in a rising channel and it has shown resilience from the horizontal line as well as the rising trend line. RSI has reversed from the oversold terrain and can reach towards to overbought. From waves perspective, prices are moving in an impulse fashion in which it has completed wave i and wave ii and now it has started moving in wave iii which is extended and it can start wave ...

Tata Motors Elliott Wave Analysis

Image
 Tata Motors daily chart Tata Motors hourly chart From the above daily chart, the auto stock is moving in a higher highs and higher low formation, this is the strongest formation for any asset class to move in a positive direction. Recently it has given a bullish break in a small falling channel which opens further positive possibilities. To embellish, from the support of the steepest trend line it has bounced thus embarking the major trend. ADX is at 18 indicating that the previous short term downtrend is on the brink to complete. As shown in the hourly chart, prices are at support and as far as it is above the steepest trend line, the stock can cross its previous high as far as there is no discontinuation of the positive formation. However, RSI is in overbought terrain and can relieve from it over couple of trading sessions. As per Wave theory, prices are moving in a double correction (a-b-c-x-a-b-c) as of now, where it has completed first correction followed by wave x and no...