Nifty Elliott Wave Analysis
Nifty hourly chart
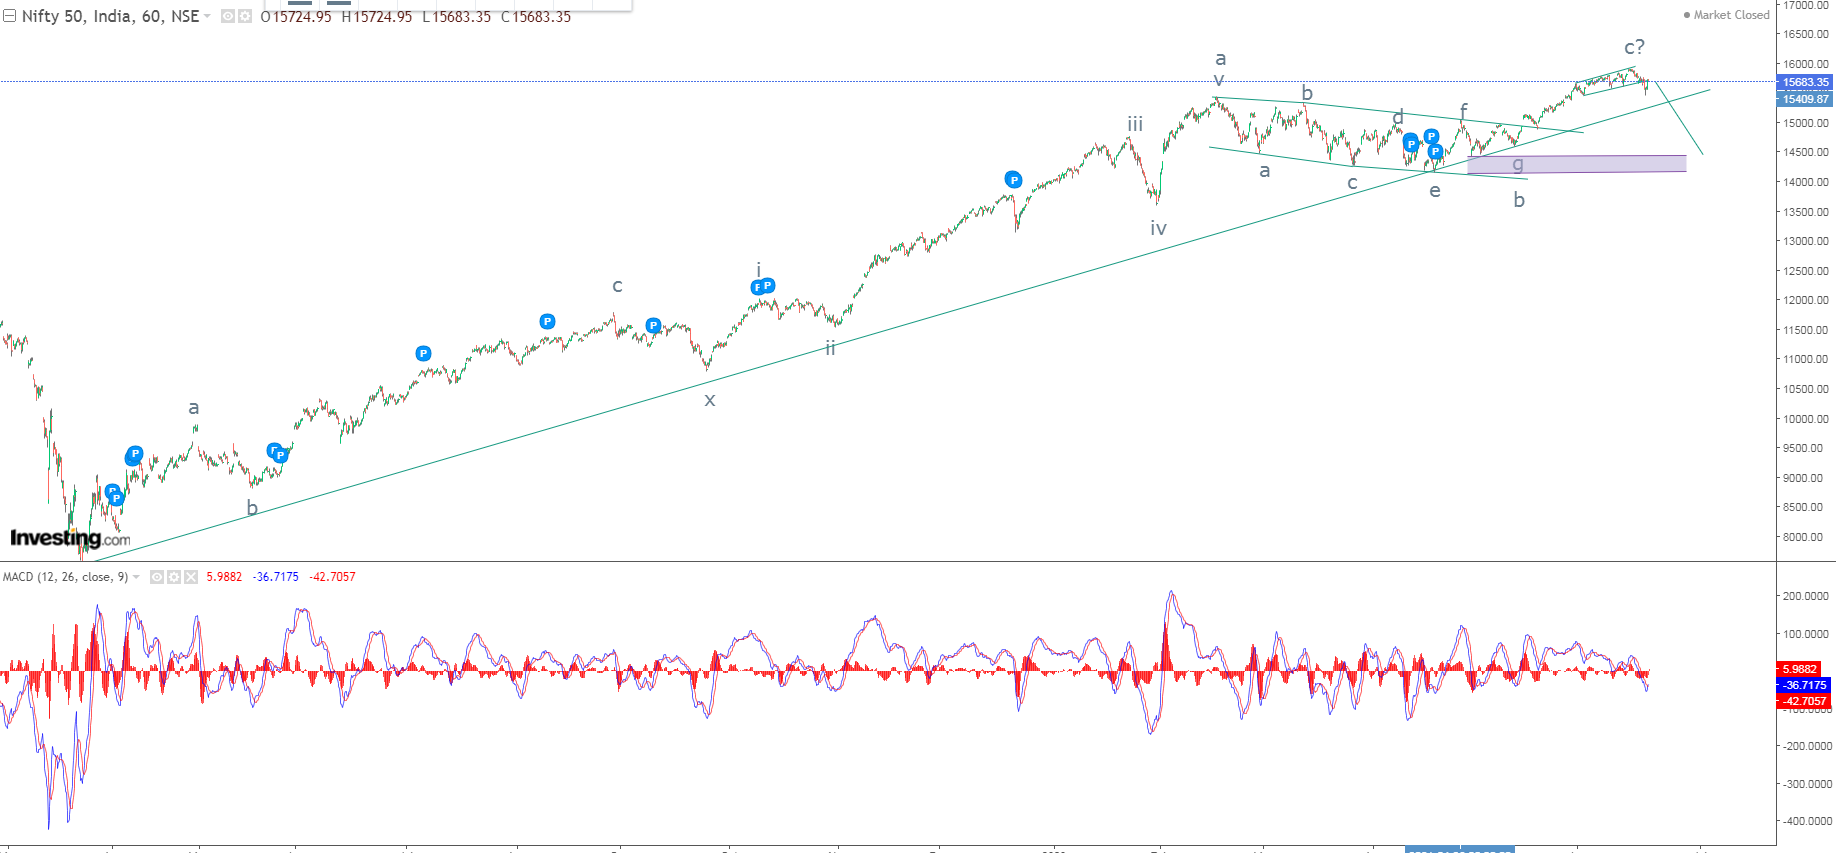
From the above hourly chart of Nifty, it is very clear that prices are moving in a higher highs and higher lows and prices are persisting above the rising trend line. However, this trend line is not going to hold for long and can be broken in coming trading days.
Buy applying MACD, the oscillator is below the center line which is 0, this means that it is showing a negative sign. Also the previous support of the MACD which has tested several times is placed at -136 levels.
As per Wave theory, prices are moving in a double correction where wave c of second correction is either ended or on the brink to end, but in wave c of second correction prices have formed expanding diagonal pattern and has given a bearish break and has also re-tested the resistance of the pattern which was earlier acting as a support.
The summation is, Nifty is all set to nose dive towards 14500 levels as far as the level of 15900 is intact on the upside.


Comments