Posts

Showing posts from July, 2021

MCX NAT GAS Anticipated Happened

Image
 MCX Nat Gas daily continuous chart anticipated on 6th June  2021 MCX Nat Gas daily continuous chart happened on 26th July 2021 In my previous article on Nat Gas, I had mentioned that, " P rices can test 200 levels over short term which can drag prices lower, buying opportunity can be expected at these levels which can soar prices towards  300 to 315 levels over medium term." I initially thought that prices are moving in a triangle pattern and so wave e of the triangle can test 200 levels which I was wrong in the short term. However, I was correct in anticipating the medium term as it can test 300-315 levels which is achieved- Anticipated Happened Here is the link of my previous article on NAT GAS https://www.marketanalysiswithmeghmody.com/2021/06/mcx-nat-gas-reversal-pattern-and.html Prices have completed wave b in a flat pattern and following that an impulse structure can be seen which is undoubtedly wave c. Now a correction either in the form of wave x or a deeper...

EURINR Neo Wave Diametric Pattern Anticipated Happened

Image
 EURINR daily continuous chart anticipated on 5th July 2021 EURINR daily continuous chart happened on 19th July 2021 In my previous update dated 5th July 2021, I had mentioned that, "  EURINR is hovering near resistance and can sink near to 87.6-87.5 levels over short term." EURINR made a low of 87.33 on 19th July 2021, thereby achieving my mentioned level of 87.6-87.5 levels- Anticipated Happened The chart shown on 5th July or 19th July or when the article is written depicts Neo Wave diametric pattern, a seven leg pattern which has lot of variations. You can see the previous article of EURINR by clicking on the link https://www.marketanalysiswithmeghmody.com/2021/07/eurinr-neo-wave-diametric-pattern.html After completing diametric pattern there are high chances for the pair to bounce or can change the trend from negative to positive. This can be the end of wave ii or wave a of wave ii, once completed wave iii on the upside will start.

ICICI Bank Elliott Wave Analysis Anticipated Happened

Image
 ICICI Bank daily chart anticipated on 4th July 2021 ICICI Bank daily chart happened on 26th July 2021 In my previous update on ICICI Bank I had mentioned that, " ICICI Bank is firmly positive and can move higher from current levels close to 680-685 levels as far as 615 is intact on the downside." The banking stock move up and achieved the level of 680-685 levels by forming an expanding diagonal pattern - Anticipated Happened As per Elliott Wave, prices which were expected to move up in the form of wave c, has converted into expanding diagonal pattern, once completed there wil be a correction either in the form of wave x or bigger correction.

MCX Copper Inverse Cup and Handle Pattern and Elliott Wave Analysis Anticipated Happened

Image
 MCX Copper hourly continuous chart anticipated on 6th July 2021 MCX Copper hourly continuous chart happened on 26th July 2021 In my previous update I had mentioned for MCX Copper, "  MCX Copper can achieve levels of 760-765 over short to medium term with support at 712." The red metal moved sideways and marked a low of 711.4 but did not closed below 712 and continued to move higher thereby achieving my level of 760-765 levels - Anticipated happened. MCX Copper has rallied over 30-35 INR from July 6, thereby gaining 4.80% . The bias over medium term will continue to be positive and can move up from here as well. Here is the link of my previous article on MCX Copper, this will show how I had predicted the rise, click on the link https://www.marketanalysiswithmeghmody.com/2021/07/mcx-copper-inverse-cup-and-handle-and.html Now If I am correct in anticipating the rise and the wave counts I had placed then MCX Copper is least likely to fall back till 725 levels. If it does then we...

Correlation amongst asset classes Part 2

Image
Correlation - Positive or Negative is more effective if you see it on the chart, for that it is imperative that you compare two asset classes of your like. I have come up with some charts where I have two different asset classes moving either in sync or inverse with each other. MCX Crude and Nifty- Positive Correlation In the above chart, the blue line is the Nifty Index and the purple line is MCX Crude Oil placed on a weekly chart. This is how MCX Crude Oil bounced after going negative and Nifty bounced after hitting the pandemic low last year. Gold and DXY- Negative Correlation As shown in the above chart, Gold is shown in the blue line and DXY in the purple, both are moving against each other giving an indication that both are inversely related. US Interest Rates and S&P500 - Negative Correlation Historically, Equities have been moving up after the end of subprime crisis, this is because the interest rates were dragged down by the FED just before the crisis. As and when the inte...

Correlation amongst asset classes Part 1

What is a correlation? Inter market analysis is a method of analyzing markets by examining the correlations between different asset classes. How may types of Correlation? There are two types of Correlation, Positive and Negative. Which is the Best Correlation? Negative Correlation. Why Negative Correlation is the best? It can help to minimize loss. For eg. There is a negative correlation in Gold and Equities, so one can invest in both the asset class to diversify the portfolio, so when there is a unprecedented event like war or Covid-19 Gold will act as a safe haven and equities can become volatile.  How to check the Correlation? The best way to understand the Correlation is to see on the charts and figure it out.  What is a Positive Correlation? A Positive Correlation is when both the asset class moves in sync with each other or can even be in tandem. What is a Negative Correlation? A Negative correlation is when two asset class show divergence or move away from each other.

BEL re-visited

Image
 BEL half hourly chart anticipated on 14th July 2021 BEL half hourly happened on 19th July 2021 In my previous update about BEL, I had mentioned that, "P rices are set to surge till 190-192 levels over short term as far as the level of 179 is intact on the downside." The stock surged till 188 levels close to my target level. To view the previous article on BEL click on the below mentioned link https://www.marketanalysiswithmeghmody.com/2021/07/bel-elliott-wave-analysis-running.html I thought that it is a symmetrical triangle pattern which eventually turned into a complex correction. One thing is for sure that wave c cannot terminate at this level and so I am still open, there is also another possibility for prices to still move in wave b and so wave c has still not started. Wave b can be as complex as possible. I will monitor the movement going forward and will update timely onto this.

USDINR Elliott Wave Analysis

Image
 USDINR hourly continuous chart From the lows of 73, prices are moving in a higher highs and higher lows and it is approaching near to its important resistance placed at 75.5 levels. RSI is also on the brink to cross its center line which will be a positive sign. Wave theory suggests that prices are moving up in impulse where in it is forming wave iv in symmetrical triangle pattern, once wave iv is over prices will start wave v which can go till 75.5 levels. Also it will complete bearish flat pattern following which the pair will start shedding all its gains and will continue to move lower and its major trend is. On immediate basis, prices can test 73 levels followed by 71 The summation is USDINR can test 75.5 levels over short term followed by 73 over medium term.

Larsen and Toubro Elliott Wave Analysis

Image
 LT daily chart From the above chart, prices are persisting above the rising trend line and has also crossed its previous cluster of resistance of 1590 levels, all are suggesting that prices are firmly positive. However, RSI is in overbought zone and can relieve in near term. As per waves perspective, prices are moving up in wave v where it can move till 1660 to 1665 levels, which is 100% of wave i. Just a guideline which says it can achieve this level. However, failure to protect the level of 1450 levels will infuse selling pressure dragging prices way lower till 1300. The summation is prices can achieve 1660-1665 levels but it is better to have a support intact for this stock, which is placed at 1450 levels. Break of this level will falter price till 1300 levels.

Tesla Elliott Wave Analysis

Image
 Tesla Daily chart As shown in the above chart of Tesla, prices have given a positive break in falling trend line. It has re-tested the trend line which is now acting as a support. There are chances it can again test it and can give whipsaw over the time, but the trend remains firmly positive for this stock. From Waves perspective, prices have completed the corrective pattern (a-b-c) in flat and is now opening another wave which will decide if it is impulse or corrective. I think it is a impulse wave and can move close enough or even surpass its previous high over medium term. The summation is Tesla stock is positively poised and can move higher near till $900 over even cross it over medium term.

MCX Lead with Elliott Wave Impulse

Image
 MCX Lead hourly continuous chart  As shown in the above chart, prices are moving in a sideways direction and the base metal is contracting, seen by two trend lines.  From waves perspective, prices are moving in an impulse fashion, where it has completed wave i followed by wave ii in a flat pattern and different from wave iv as wave iv is in symmetrical triangle pattern. Wave iii is longer than wave i and so wave v is pending on the upside. The summation is MCX Lead can surge till 183-185 levels once it crosses the level of 179.8 decisively.

BEL Elliott Wave Analysis, Running Triangle

Image
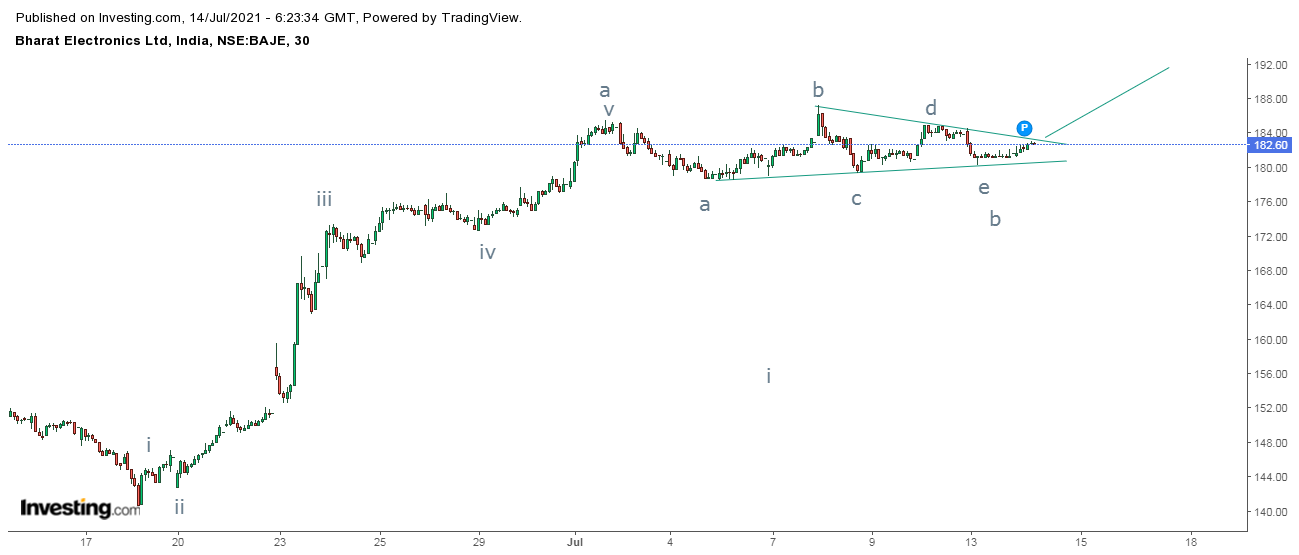
 BEL half hourly chart From the above chart, prices are moving in a sideways direction where two trend lines are converging, thus giving an indication that prices are moving in a narrow range. The narrow range can be seen as a triangle pattern that too symmetrical one but the catch is it is running triangle.  From waves perspective, prices are moving in wave b where it has formed running triangle pattern where wave b is bigger than wave a of the pattern. This pattern is complete and prices are set to open wave c higher. The summation is prices are set to surge till 190-192 levels over short term as far as the level of 179 is intact on the downside.

MCX Zinc re-visited with Neo Wave Diametric pattern

Image
 MCX Zinc hourly continuous chart anticipated on 7th July 2021 MCX Zinc hourly continuous chart happened on 9th July 2021 In my previous update on MCX Zinc dated 7th July, I had mentioned that, " Zinc is in positive terrain and can move higher from current levels till 244-245 levels over short to medium term." Prices did not reach till 244-245 levels but it made a high of 243.6 which was close to my mentioned level. Also it was achieved in a very short span of time- two trading sessions. Here is the link of my previous article on MCX Zinc dated 7th July 2021 https://www.marketanalysiswithmeghmody.com/2021/07/mcx-zinc-elliott-wave-analysis.html The best part of this chat is prices formed Neo wave diametric pattern in wave b which I anticipated that it was a flat pattern. Neo wave Diametric Pattern comprises of seven legs (a-b-c-d-e-f-g) and then wave c is clearly seen, which was anticipated by me.

Tata Steel Anticipated Happened and Elliott Wave Analysis

Image
 Tata Steel daily chart anticipated on 30th June 2021 Tata Steel daily chart happened on 12th July 2021 In my previous update on Tata Steel dated 30th June 2021, I had mentioned that " Tata steel is positively poised and can move higher from current levels and can test 1250 levels followed by 1280 levels over short term." Today prices opened at 1254 levels thus achieving my first target for the steel stock thus, gaining 6.30% in span of 7 trading sessions - Anticipated Happened. To read the previous article on Tata Steel click on the the below link https://www.marketanalysiswithmeghmody.com/2021/06/tata-steel-elliott-wave-analysis.html Now my second target is still pending which can be achieved in coming trading sessions thus completing wave (iii) followed b wave (iv) and wave (v), thus completing wave v in extension within extension. I will monitor this stock and keep updating, but one thing is sure that the stock still has upside left.

Bitcoin Elliott Wave and NEO Wave Analysis

Image
 Bitcoin daily chart From the above chart of BTC, prices are slumping from the top and currently the angle of the fall is shifting from 90 to 45 degrees which is an indication that prices are on the brink to change the trend from negative to positive. As per Wave theory, prices faltered after ending diagonal pattern but at the bottom there is a reversal pattern happening which is Neo wave diametric pattern. In this pattern there are seven legs (a-b-c-d-e-f-g), in this case it has completed wave f and will move down last leg in form of wave g. Once it is over, prices will move higher towards $44500-$44700 levels. The summation is prices can test the level of $30000 over short term followed by $44500-$44700 levels over medium term.

Gail Elliott Wave Analysis, Expanding diagonal, Irregular flat

Image
 Gail daily chart As shown in the daily chart, the rising trend line which was acting as a support is now broken, thus opening negative possibilities. However, there is no discontinuation of the positive formation which only price can give over a time. From waves perspective, prices have move up in a corrective pattern (a-b-c) where wave c ended up in expanding diagonal pattern, followed by wave b at one larger degree where it is suppose to complete in irregular pattern. Wave b of wave b has surpassed wave a which opens irregular flat pattern. Now wave c of wave b is pending which can test the lows of wave a of wave b. The summation is, prices are suppose to plunge till 130-132 levels with the resistance at 157 levels (closing basis).

Nifty Bank Elliott Wave Analysis

Image
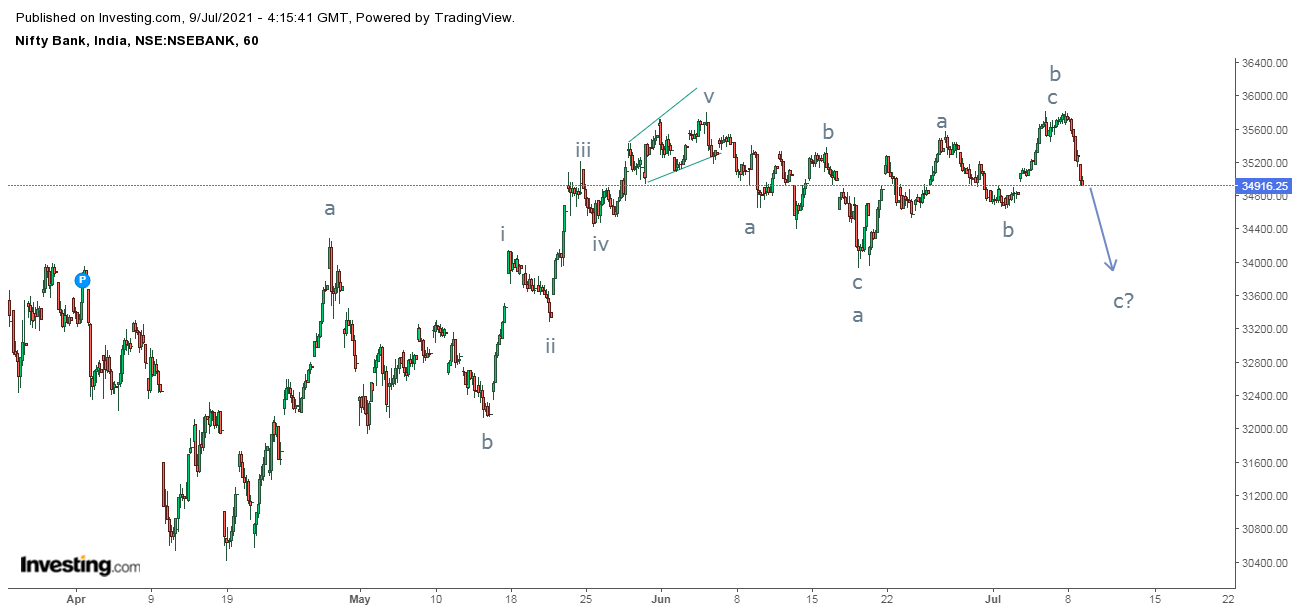
 Nifty Bank hourly chart As shown in the above hourly chart, Nifty Bank is moving in a range of 2000 points from 36000 to 34000. Recently it faced the resistance of 36000 and today it has shown signs of correction which can drag prices near to the support placed at 34000. From Waves perspective, prices are moving in a flat pattern where wave a and wave b is over and wave c has started which can go slightly below wave a end placed at 34000.  The summation is Nifty Bank is negatively poised for short term and can test 34000 in couple of trading sessions.

US 10 year yields Fundamentals and Technicals

Image
 US 10 year yields daily chart As seen in the above daily chart of US 10 year yield, prices are moving in a lower highs and lower lows and the angle of the trend line is also changing as steepness has been intensified. However, the previous formation in the chart looks to be like a rounding bottom or a inverse cup and handle pattern, right now the correction can be the handle which can drag prices close to 1.05 where 50% of the retracement is placed. Fom Wave theory, prices are moving in wave b at one higher degree which can drag prices lower following that wave c will start surpassing the resistance of 1.78-1.80 levels. Fundamentlly, FED minutes and the data coming from US in the month of June indicates that the economy is doing quite well and tapering the bond purchase can be stopped soon enough, this means it can be next year and the rate hike can be seen next year or at the end of 2023. Hawkish stance is been taken by many FED officials which will take prices way higher but now...

MCX Zinc Elliott Wave Analysis

Image
 MCX Zinc hourly continuous chart From the hourly chart, the base metal is surely moving in a positive direction after forming a bullish cup and handle pattern. As far as the low of the handle is intact prices will continue to surge. Also, yesterday it came back to test the support of the horizontal trend line which was earlier acting as a resistance (marked by arrows), this is an indication that prices are at crucial support and can bounce back from this juncture. As per Wave theory, I think prices are moving in a corrective wave (a-b-c) where it is on the brink to complete wave b in a flat pattern and might or will start wave c higher which can go till 244-245 levels. The summation is Zinc is in positive terrain and can move higher from current levels till 244-245 levels over short to medium term.

MCX Copper Inverse Cup and Handle and Elliott Wave Analysis

Image
 MCX Copper hourly continuous chart As shown in the hourly chart, MCX Copper has given a bullish break in an inverse cup and handle chart and also a bullish break in a falling channel, thus opening positive possibilities. As per the pattern the target comes to 763 levels. From Waves perspective, Copper is positively poised as it has completed a corrective wave (a-b-c) and following that it has started impulse wave, in which it has completed wave i and possibly wave ii. This opens wave iii higher which can go till 760-765 levels. The summation is MCX Copper can achieve levels of 760-765 over short to medium term with support at 712.

EURINR Neo Wave Diametric Pattern

Image
 EURINR daily continuous chart From the above daily continuous chart, prices are moving in a sideways to negative direction after a dynamic rise, this can be seen as a move to digest the recent gains. Also there is a certain percentage where prices can retrace, if not then reversal is the beginning orelse a correction. At present it has retraced 50% and it is likely to go and test 61.8%. As shown in the chart, from Neo Wave perspective, prices are moving in a diametric pattern which has seven legs in it (a-b-c-d-e-f-g). Here in this case wave g is pending on the downside which can drag prices near till 87.6-87.5 levels. The summation is EURINR is hovering near resistance and can sink near to 87.6-87.5 levels over short term.  

ICICI Bank Elliott Wave Analysis

Image
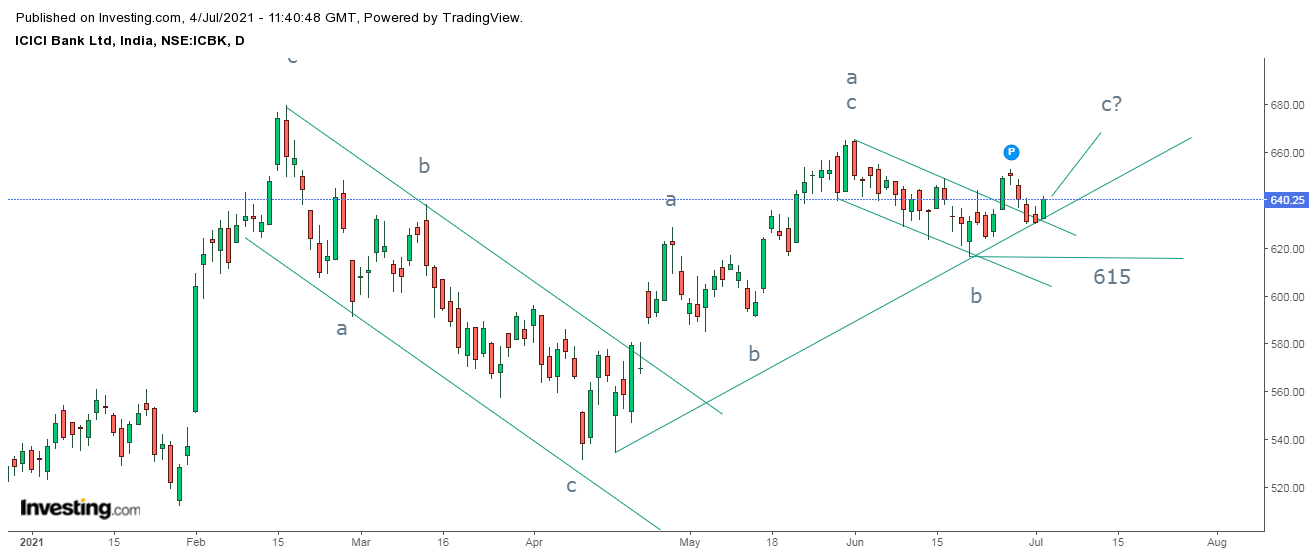
 ICICI Bank daily chart From the above daily chart, the banking stock is in stealth uptrend and will continue to do so as far as prices persist above the rising trend line or there is no discontinuation of the positive formation. The stock recently gave a bullish break in a small falling channel and then came back to re-test the trend line which is now acting as a support (role reversal).Also it is showing signs of resilience from the support zone. As per Wave theory, prices are moving in a flat pattern which can be converted into irregular flat or even a running. This mean I am anticipating wave c of final wave b at one higher degree to either test 680-685 levels over even surpass it which will probably complete wave b. The summation is ICICI Bank is firmly positive and can move higher from current levels close to 680-685 levels as far as 615 is intact on the downside.

Ethereum ETH/USD Re-visited and Elliott Wave Analysis

Image
 ETH/USD daily chart anticipated on 31st May 2021 ETH/USD daily chart happened on 3rd June 2021 In my previous update on Ethereum dated 31st May 2021, I had mentioned two probabilities and it happens to be the former one to be successful. " In wave b wave wave a and wave b is over and wave c can surpass wave a of wave b which can move till $2900-3000 levels." Here is the link of my previous article on ETH, click on it https://www.marketanalysiswithmeghmody.com/2021/05/ethusd-elliott-wave-anaysis.html Here in this case price did not surpass but came close to $2900 which is 50% of the recent fall thus making it a simple zigzag pattern. The falling trend line is crossed thereby giving a bullish break and now there is high possibility for prices to climb over short to medium term. As per waves perspective, prices are moving in an impulse fashion after the bullish break, in which it has completed wave i and wave ii and it is on the verge to start wave iii which can reach near till...

USDINR Re-visited

Image
 USDINR daily continuous chart anticipated on 13th June 2021 USDINR daily continuous chart happened on 2nd July 2021 In my previous update on USDINR dated 13th June I had mentioned, " USDINR can move higher from here and can test 73.5 levels over short term and further if it sustains above it can move till 75-75.3 levels over medium term." Prices surged from the support of the trend line and achieved my level of 73.5 followed by 75-75.3 as the pair made a high of 75.07-  Anticipated Happened. Here is the link of my previous update on USDINR which you can read just by clicking on it https://www.marketanalysiswithmeghmody.com/2021/06/usdinr-elliott-wave-analysis-and.html In past two weeks there is been huge volatility in global markets after FED dot plot revealed that they are all set to hike interest rate by 2023. Two rate hikes are all set by FED, but was this the real reason or it was well anticipated ahead of the event as USDINR achieved all my levels. As per wave theory, ...

MCX Gold Elliott Wave Analysis ahead of NFP data

Image
 MCX Gold daily continuous chart As shown in the daily chart of MCX Gold, prices are moving in a sideways direction in range of 50000-46500, as far as prices persists in this range no directional move can be expected.  At present juncture, prices have bounced from the support level of 46500 and can move higher from here. US is set to release June NFP numbers at 6.00 pm IST. The consensus is 725k and the previous reading is 559k.  There are high chances for gold to move higher and capture 49200-49500, the reason is based on technical assumptions. As per Wave theory, prices are either moving in an impulse or Corrective wave. As long as the support of 46500 holds prices are set to move higher in form of wave c or wave iii which can soar prices near till 49200-49500 over short term. The summation is Gold is set to move higher from current levels to test 49200-49500 levels as far as 46500 is protected on the downside.

Power Grid Trend Line and Elliott Wave Analysis

Image
 Power Grid daily chart From the above chart, prices are moving in a higher highs and higher lows which indicates that the trend  is positive. However, trend line which is an integral part of technical analysis suggests that the trend has changed. There are two trend lines, the steeper one in comparison of two has been broken which can accelerate selling pressure towards the support of the flatter. As per Wave theory, prices are moving in a a-b-c correction where I think it has completed  wave c in an expanding diagonal pattern, I will monitor the move which can convert into double correction (a-b-c-x-a-b-c) or complex correction (w-x-y). As of now there can be a sell off which can drag prices lower. The summation is prices are negatively poised and can move down towards 221-219 levels over short term.