DLF Anticipated Happened Elliott Wave Analysis
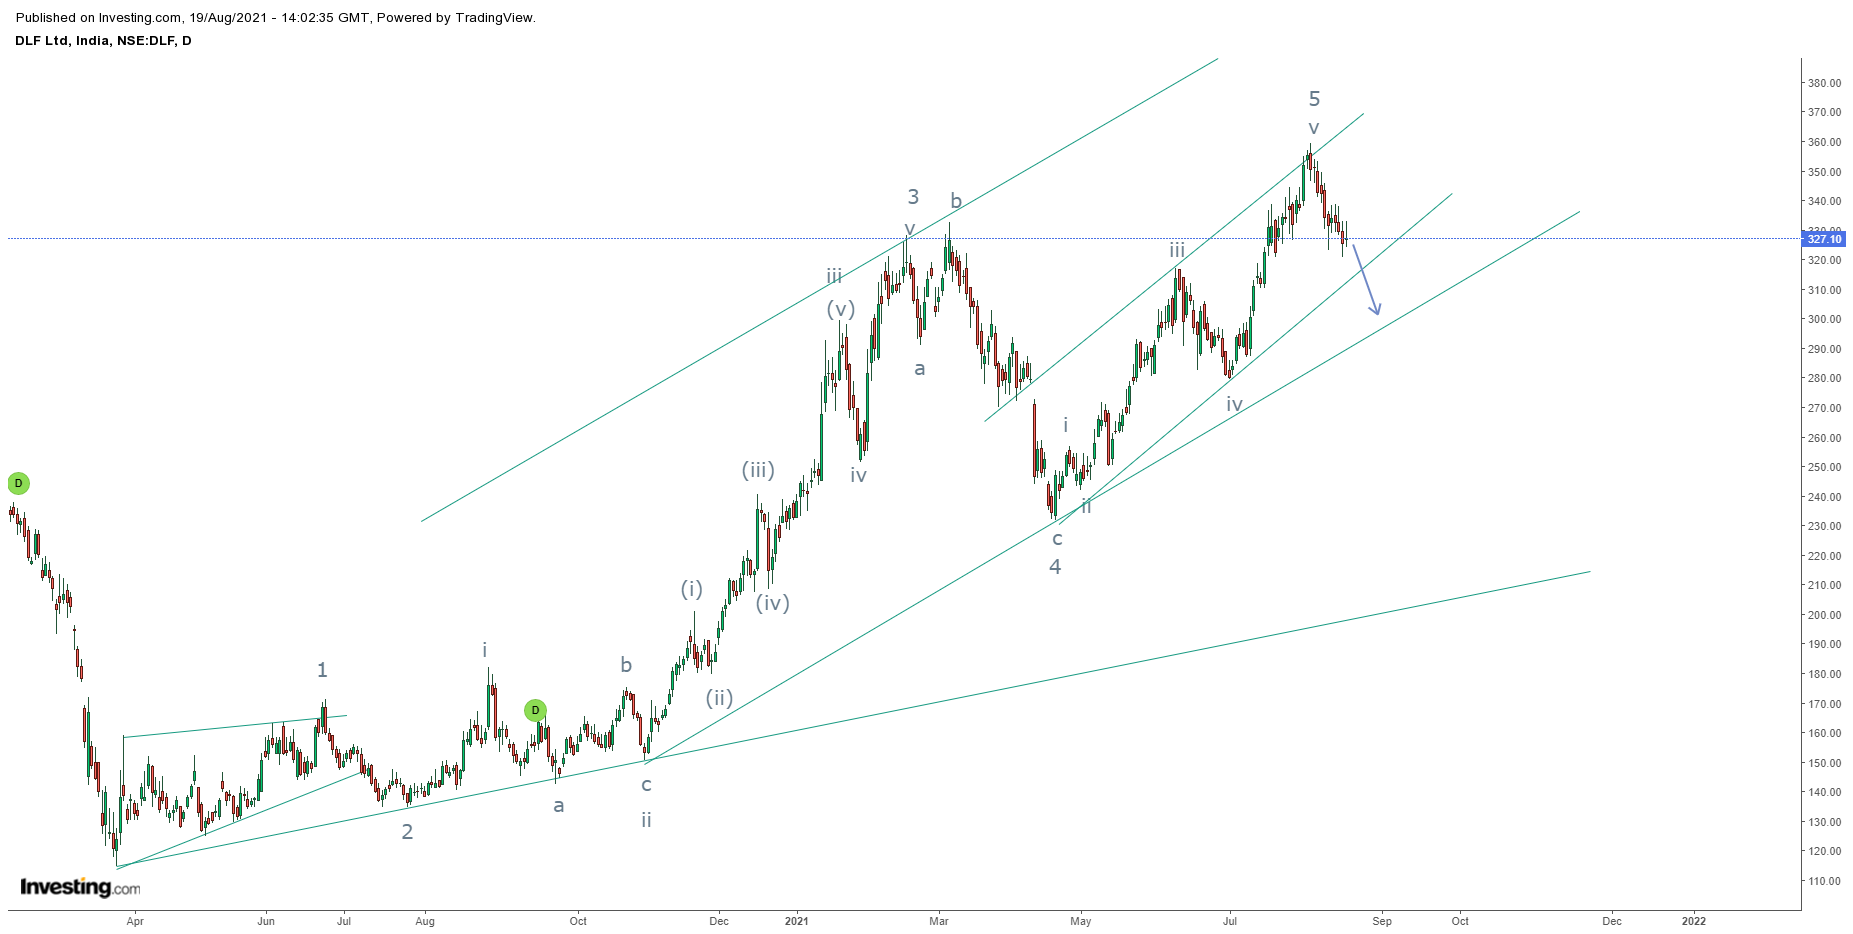
DLF daily chart anticipated on 19th August 2021
DLF daily chart happened on 20th August 2021
In my previous update on DLF, I had mentioned that, "DLF is expected to dip till 310-305 over short term with resistance placed at 340."
The stock faltered and closed at 309 on the last trading day of the week and marked a low of 306.5, thereby achieving my mentioned level in a single day after the previous article on DLF- Anticipated Happened.
Please click on the link to see the previous article on DLF
https://www.marketanalysiswithmeghmody.com/2021/08/dlf-elliott-wave-analysis.html
The stock has given a bearish break in a rising channel formation and can even sink further now to the next possible support placed at 295-298 levels over short term.
The summation is DLF is now weak and can move down towards 298-295 levels in near term.


Comments