MCX Gold Elliott Wave Analysis
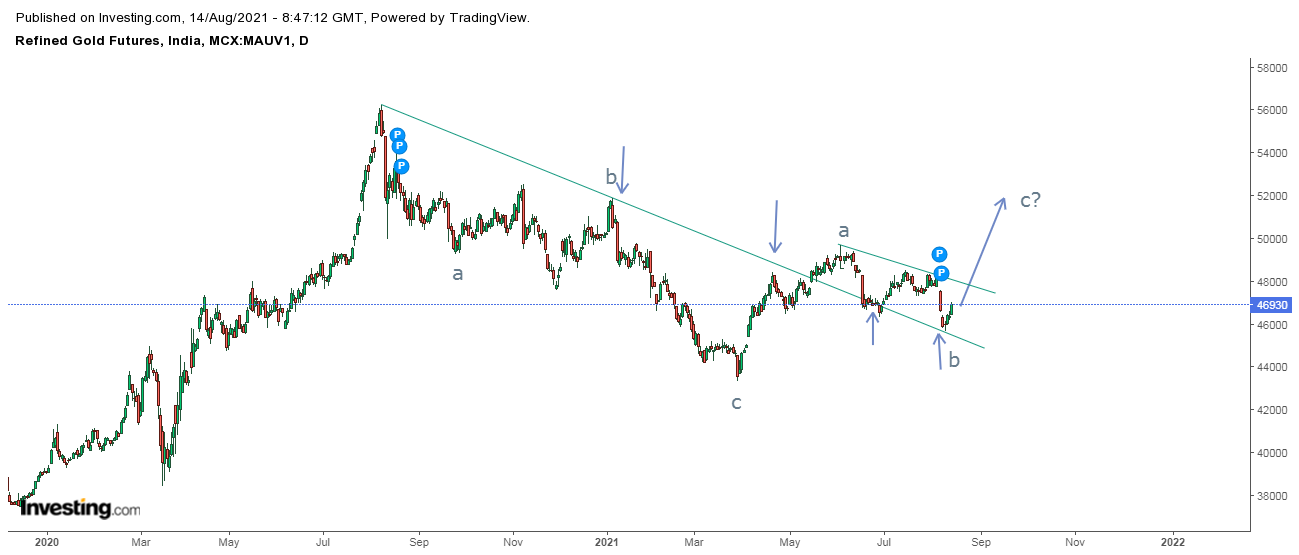
MCX Gold daily continuous chart
From the above daily chart prices has given a bullish break in a falling trend line which is a positive sign and last week it was re-tested hanks to robust July NFP data which cracked gold prices. However, the fall was snapped in the weekly close, as it was well above the crucial level of 46500 levels. closing at 46930.
If prices sstain above the recent low of 45800 it can reach till its immediate resistance at 47800 and a move above this level will open the possibility of 50000-51000 levels.
As per wave perspective, prices are moving in corrective wave, where it has completed wave a folowed by wave b and now wave c is on the brink to start.
The summation is MCX Gold prices are set to reach till 47700-47800 levels in near term and 50000-51000 over medium term with support placed at 45800 (closing basis).


Comments