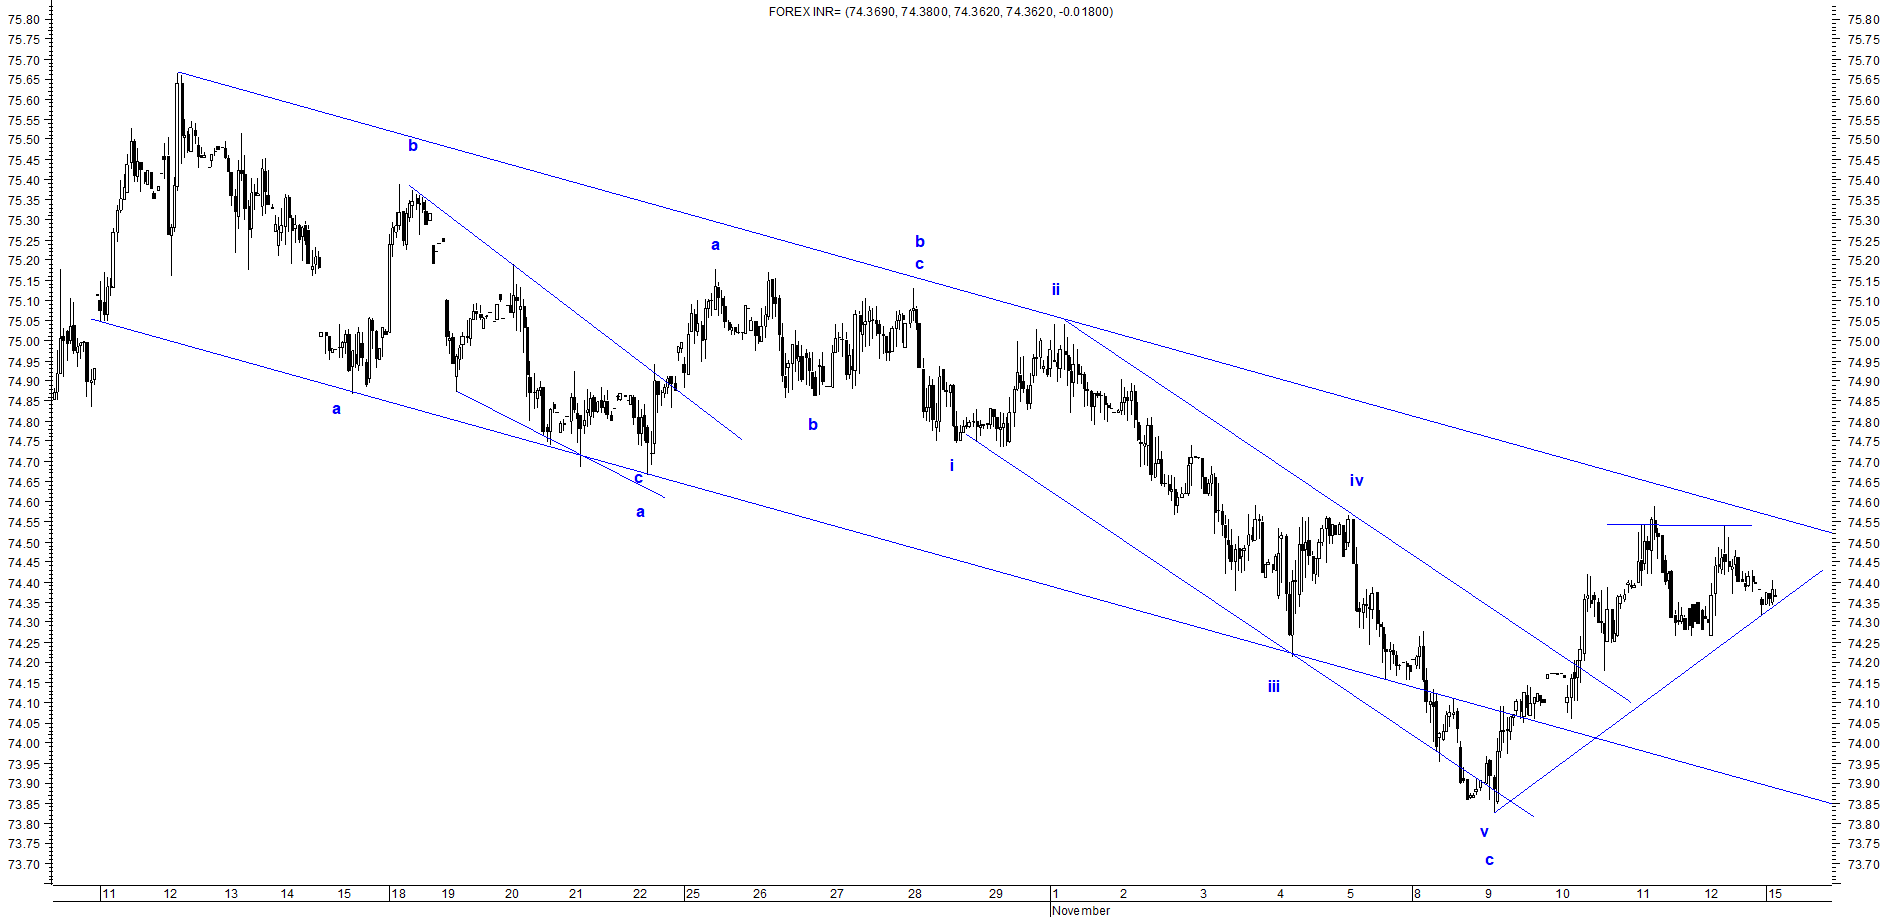
USDINR : Change of trend (Part2) and Elliott Wave Analysis
USDINR Spot daily chart anticipated on 15th November 2021
USDINR Spot daily chart anticipated on 26th November 2021 (Part 1)
USDINR Spot daily chart happened on 6th December 2021
From the above chart, I have been continuously saying that the correction is bound to be over once the level of 74.7 is taken out which can soar prices till 75.5. This is what I had mentioned for USDINR (Spot price), "USDINR is all set to move higher from here and can reach till 75.5 over short term once the level of 74.7 is crosses decisively."
On 6th December 2021, prices made a high of 75.47 which completes my target of 75.5 thus again helping me to achieve the impossible by applying Elliott Wave Theory.
To read the previous article on USDINR you can click on the below link
USDINR : A Completion of Corrective Pattern
https://www.marketanalysiswithmeghmody.com/2021/11/usdinr-completion-of-corrective-pattern.html
USDINR : Change of trend (Part 1)
https://www.marketanalysiswithmeghmody.com/2021/11/usdinr-anticipated-happened-and-elliott.html
After reading the above two articles, here I am giving you the article of USDINR as this rally will continue to move on and test 76 over even higher.
I will monitor the movement in this pair, as currently the five waves are completed unless wave v is extended, a correction is due which needs to be analyzed and then I will again come back with USIDNR.


Comments