Bitcoin: Revisited
Bitcoin hourly chart
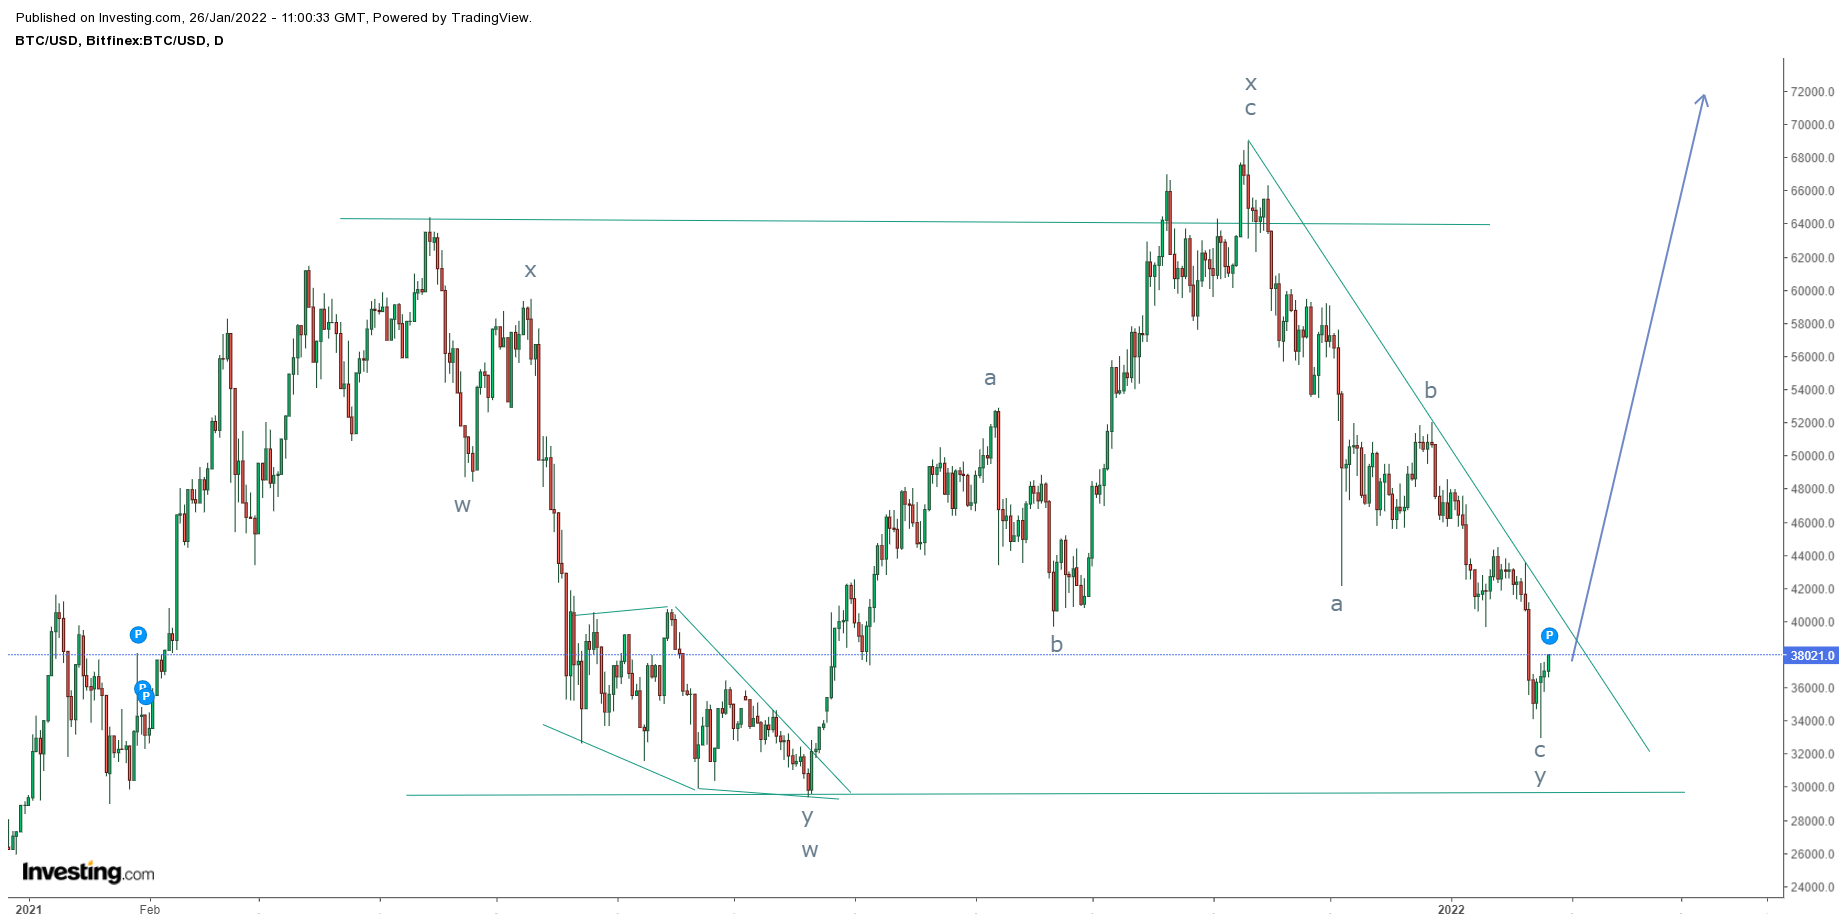
I have updated Bitcoin not long ago and I was into two minds that either it will bounce from $40000 levels or if broken will move towards $35000 levels. The level of $35000 is crucial as this level was tested before and from there it has made an all time high.
My view for Bitcoin is $75000 by this year as it bounce from current levels and reach towards it. This I had mentioned in my previous article as well. Here is the link of my previous article of bitcoin
https://www.marketanalysiswithmeghmody.com/2022/01/bitcoin-elliott-wave-analysis.html
It is imperative for prices to move above $40000 levels for the trend to change from negative to positive which will open doors for $75000.
From Waves perspective, prices completed (w-x-y) pattern and will now move higher once the above mentioned level is crossed decisively
The summation is BTC is all set to move higher towards the level of $75000.


Comments