Ethereum: Elliott Wave and Neo Wave Diametric pattern
ETH/USD hourly chart
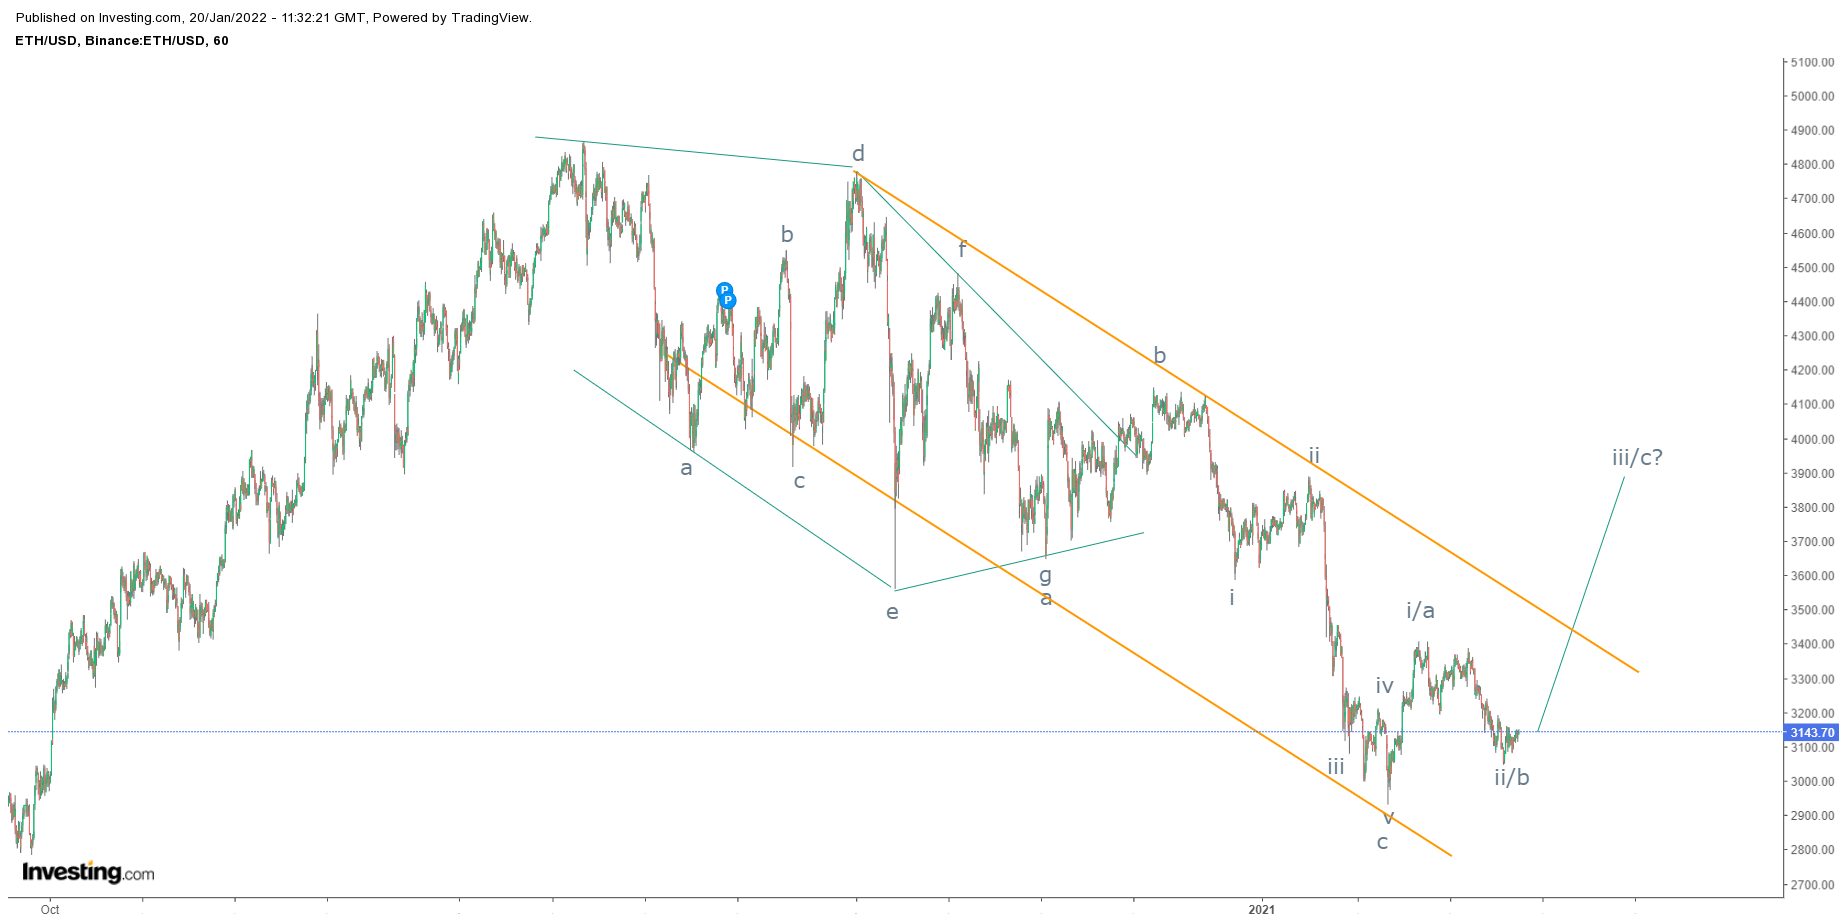
As shown in the above chart, prices are moving in a lower highs and lower lows and it persists in the falling channel. However, the recent low is protected and prices are likely to move higher from current levels which can give bullish break in falling channel pattern.
From Waves perspective, prices moved down in a Neo Wave diametric pattern, followed by three waves up to complete wave b and then wave c lower which completes one corrective pattern. After completing the corrective cycle there are high chances for this crypto to reverse.
The summation is Ethereum is all set to reverse and can test the first resistance placed at $3900 over short to medium term.


Comments