Bharti Airtel: Complex Correction in making
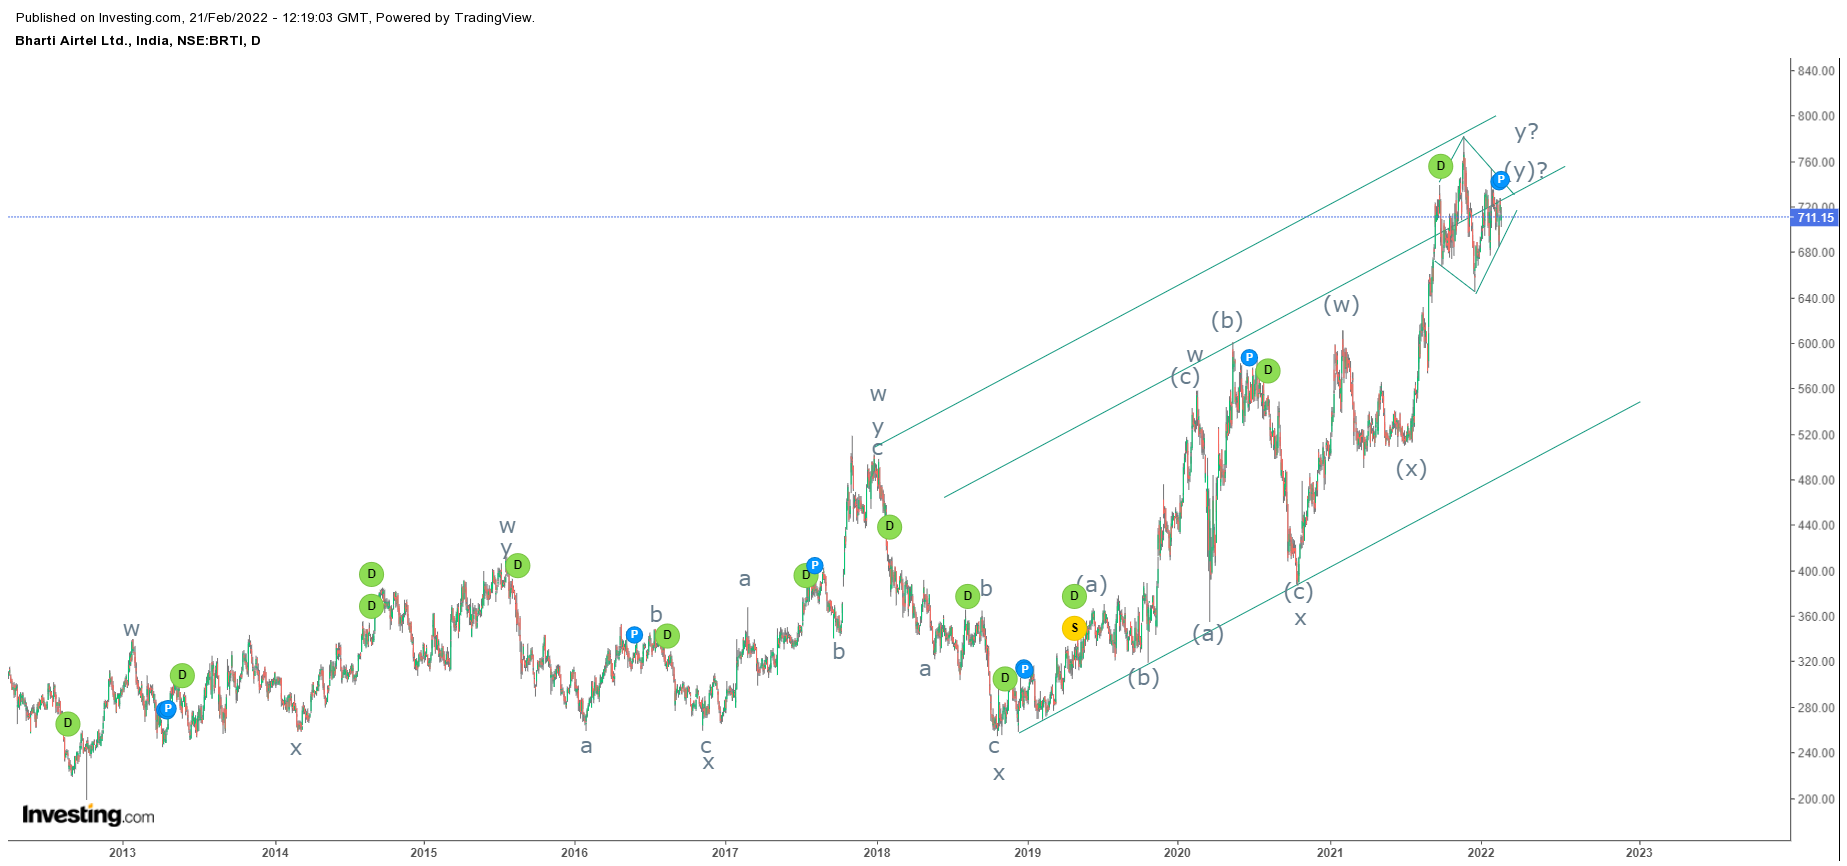
Bharti Airtel daily chart
The telecom stock is moving higher by crossing its previous high, thereby opening positive possibilities. However, prices have arrived near the resistance of the rising channel which indicates caution. Prices here are forming a distribution pattern and can reverse any time soon.
From waves perspective, prices are moving in a complex correction (w-x-y). I have marked w-x-y but it can also be w-x-y-x-z counting. I think in my wave y prices are forming Neo wave diametric pattern (a-b-c-d-e-f-g), where wave g is in making and once it is over, prices will correct thereby completing the complex correction.
The summation is Bharti Airtel can move sideways from here and then reverse correcting till 620-610 levels over medium term.


Comments