Nifty: Elliott Wave Analysis
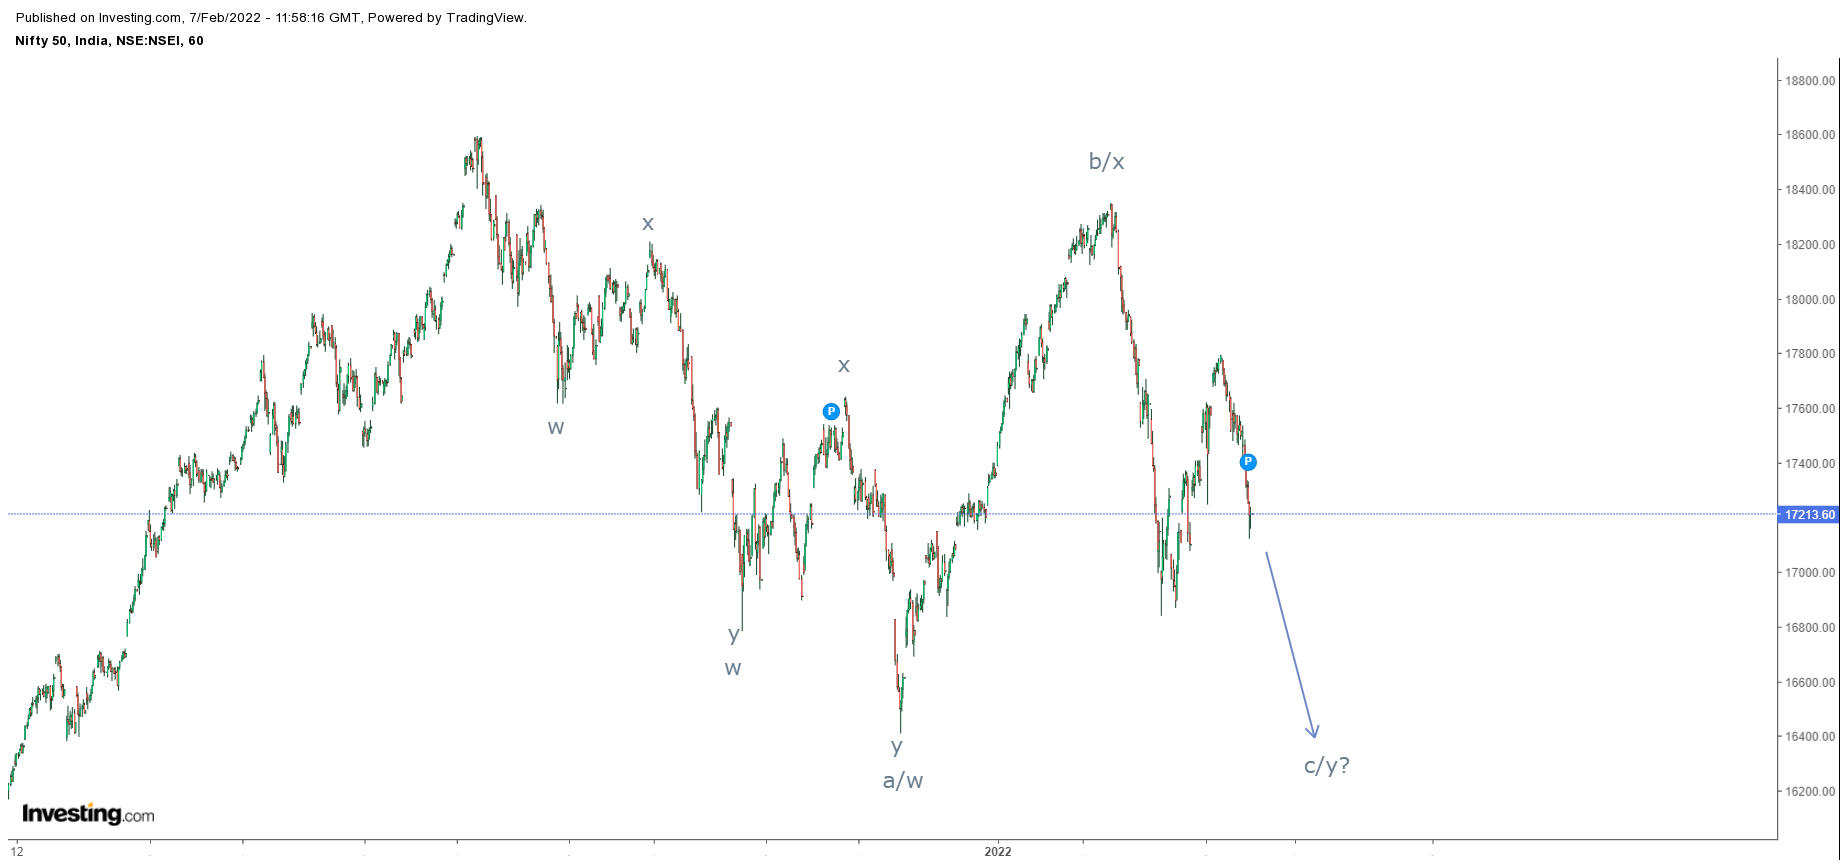
Nifty hourly chart
As shown in the above chart, Nifty is moving in a complex correction and to decode it, I have come up with plausible scenario. To put it in a basic way, prices have failed to cross its previous all time high and has started moving lower. To embellish prices are as of now moving in a rage of 18800-16400 levels. Recently it managed to test its previous highs or near to it, now there are high chances for the index to test the support.
From Waves perspective, prices are moving in a (w-x-y) pattern, where prices have completed either wave a/w at 16400 followed by wave b/y and now it is moving down in form of wave c/y. This current ongoing wave can test 16400-16000 levels over short term.
The summation is Nifty is all set to plunge to test 16400-16000 levels over short to medium term.


Comments