Bank Nifty: Neo Wave Extracting Triangle and Forecasting
Nifty Bank 60 mins chart
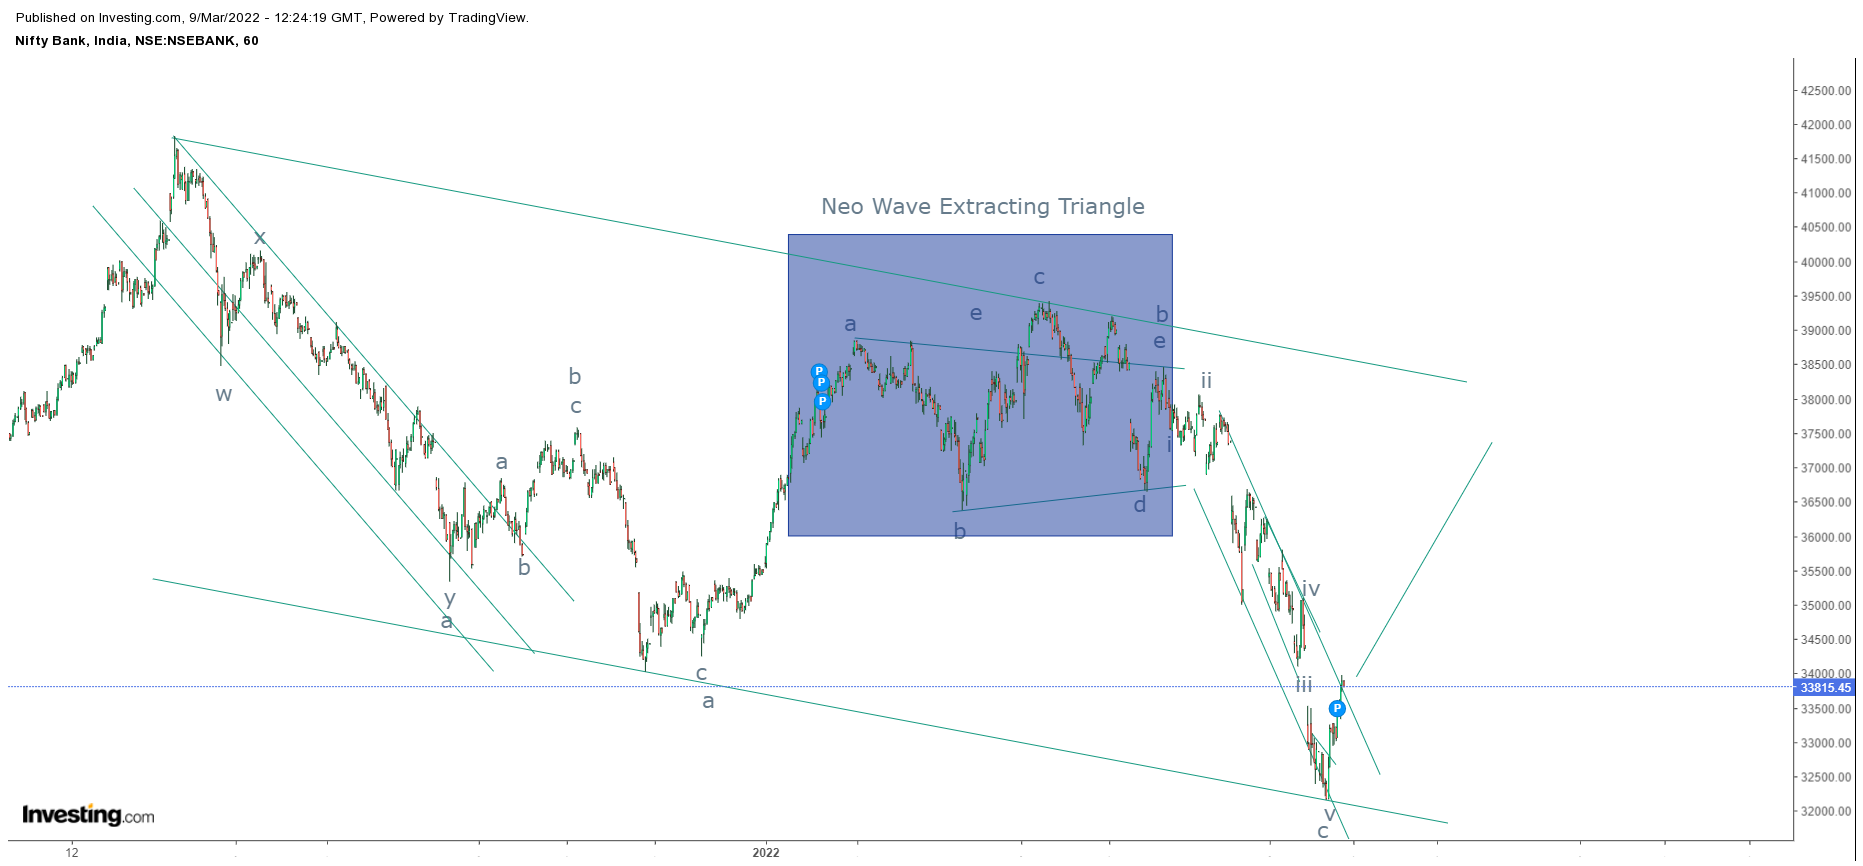
As shown in the above chart, prices are moving in falling channel and it has showing sign of reversal from the support of the channel. Today the fall after the shaded portion which is moving down in a small falling channel is broken thus opening positive possibilities.
As per Neo Wave Analysis, I think wave a was completed at 34215 levels followed by wave b in Extracting Triangle pattern and wave c at 32150 levels. Also wave a is equal to wave c i.e. 100%. This means prices are at confluence zone of Fibonacci levels along with trend line support. So now the index can move higher from here till 37000-37300 levels over short period of time and continue wave x or can break this channel. Just like Nifty, Nifty Bank can also break channel and soar.
The summation is Nifty Bank is positively poised and can move higher from current levels towards 37000-37300 over short term.


Comments