Hang Seng Fut: Double Correction?
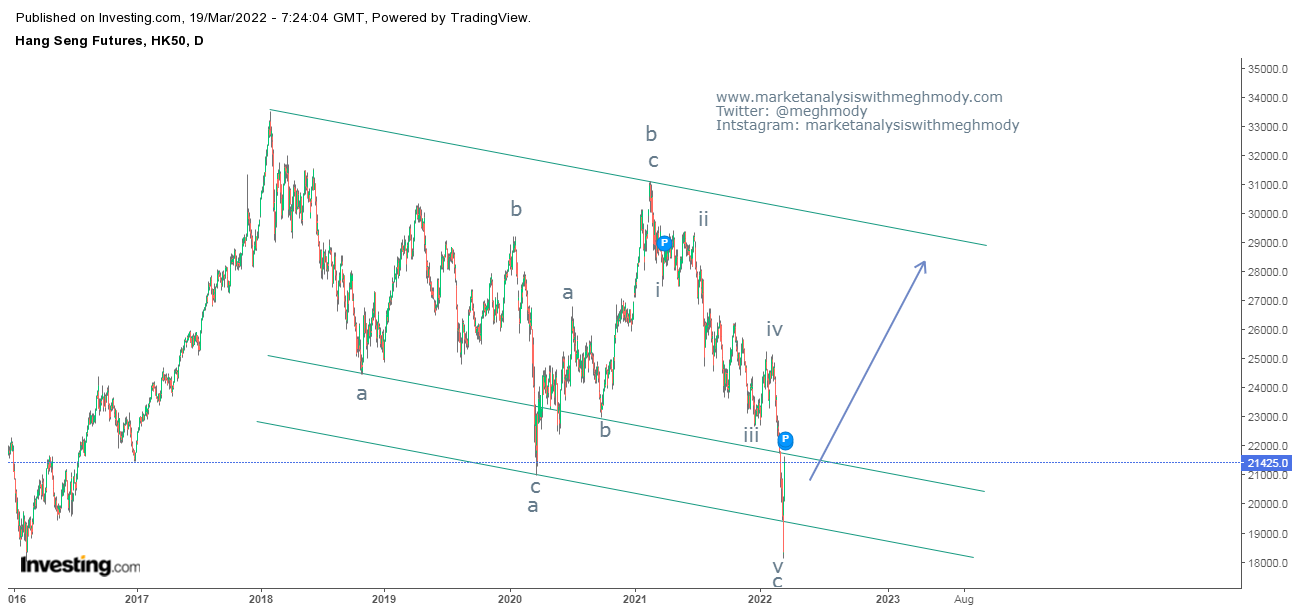
Hang Seng Daily fut continuous chart
From the above chart, prices are moving in a lower highs and lower lows which indicates that the trend is negative. However, the index has bounced from the lower end of the falling channel which opens the possibility of a resilience.
As per Elliott wave, prices have completed a corrective wave a-b-c and there is a high possibility for wave x to form. However, if prices break this falling channel then new high is imminent and the index can soar ahead.
The summation is Hang Seng is likely to move up till 28000 levels over short term.


Comments