Nifty Metal Index: Elliott Wave Anlysis
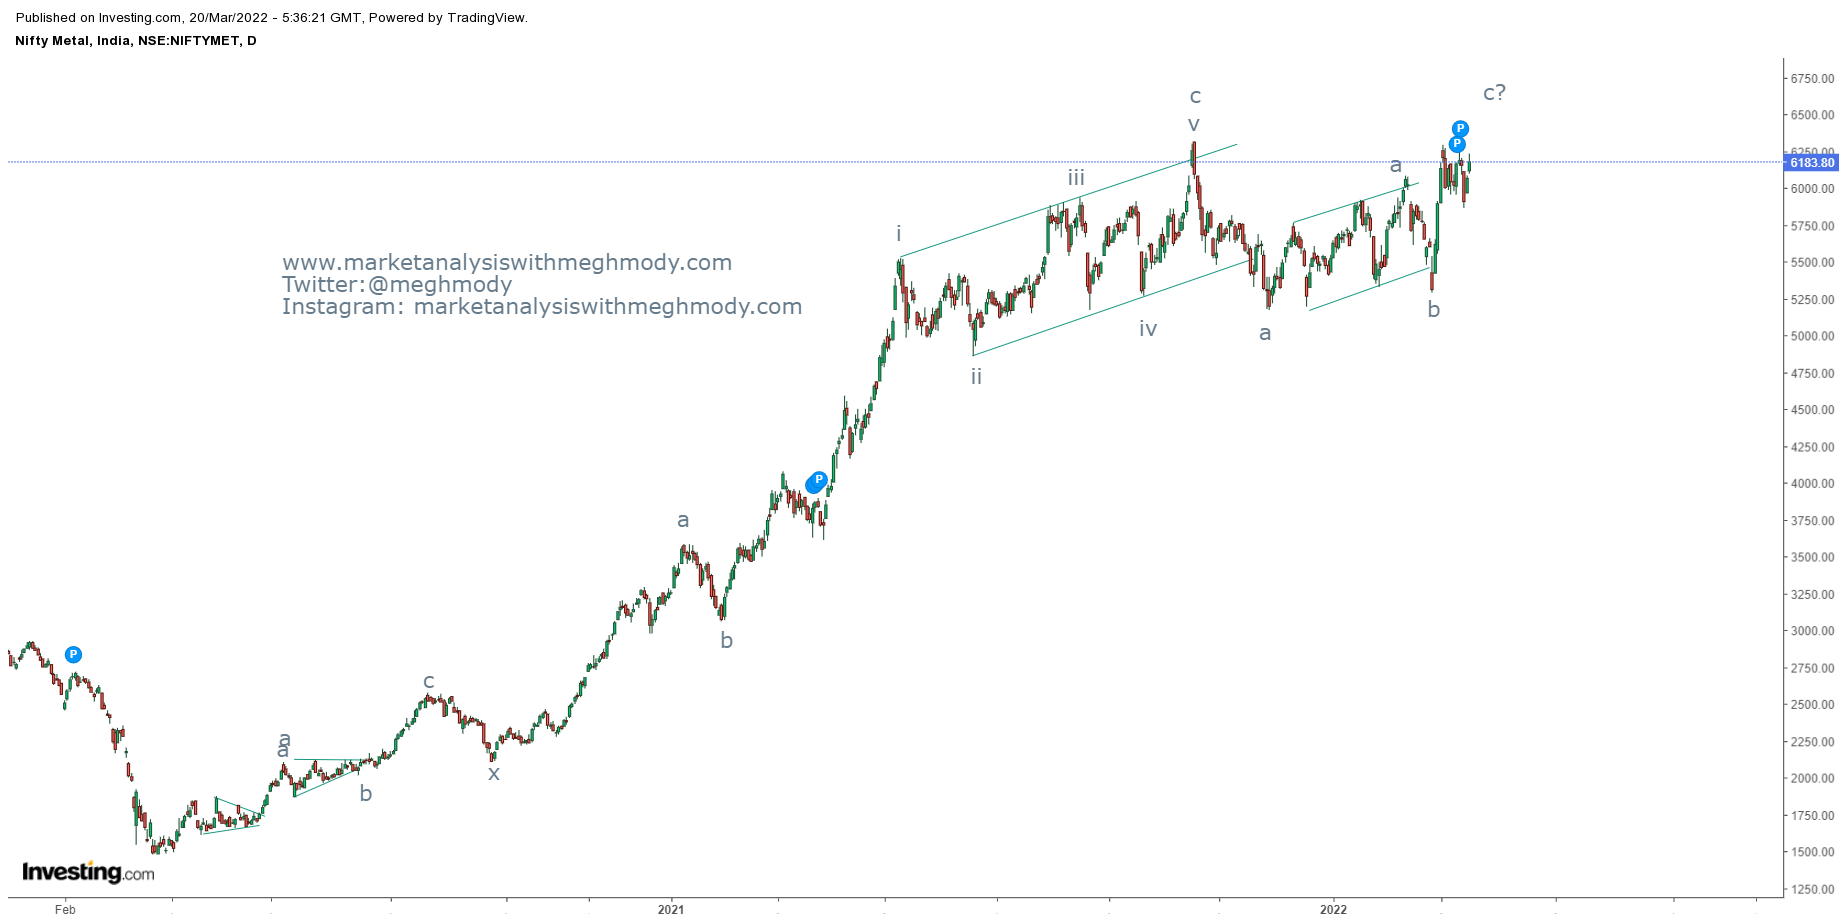
Nifty Metal Index daily chart
From the above chart, prices are moving in a higher highs and higher low and it continues to surge. The index is showing a immense strength and can even cross its previous high going ahead.
As per Wave Analysis, the index has completed wave a in double correction and it is currently moving in wave b which can be a flat pattern (a-b-c), mostly irregular flat which can go to 6570 to 6750 levels.
The summation is Nifty Metal Index is positively poised and can move towards 6570-6750 levels over short term.


Comments