MCX Copper: Elliott Wave Analysis
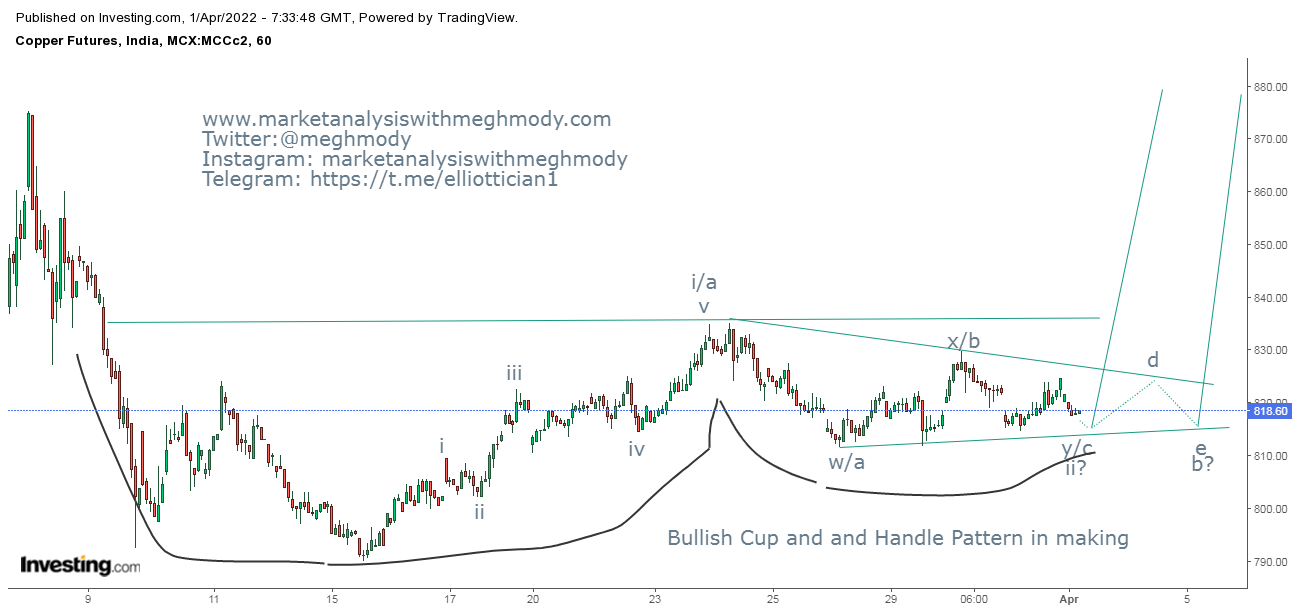
MCX Copper continuous 60 mins chart
From the above chart, MCX Copper is moving in a sideways direction, with the range becoming narrower going ahead. With this scenario one can possibly open triangle pattern. There is also another pattern in making which is bullish cup and handle pattern. The pattern will only be completed once it decisively breaks the level of 840.
As per Elliott Wave, prices are either moving in wave ii or wave b at present. If the metal forms a triangle pattern then it will be clear that wave b has formed and wave c on the upside is pending. To form triangle, it will take time.
The other possibility is, prices will reverse and break 840 levels from here which will complete wave ii lower in the form of (w-x-y). In both the scenarios, the red metal is set to move higher, particularly above 840.
The summation is MCX Copper needs to break 840 on the upside which can infuse additional buying soaring prices till 870-880 levels.


Comments