MCX Crude: Anticipated Happened
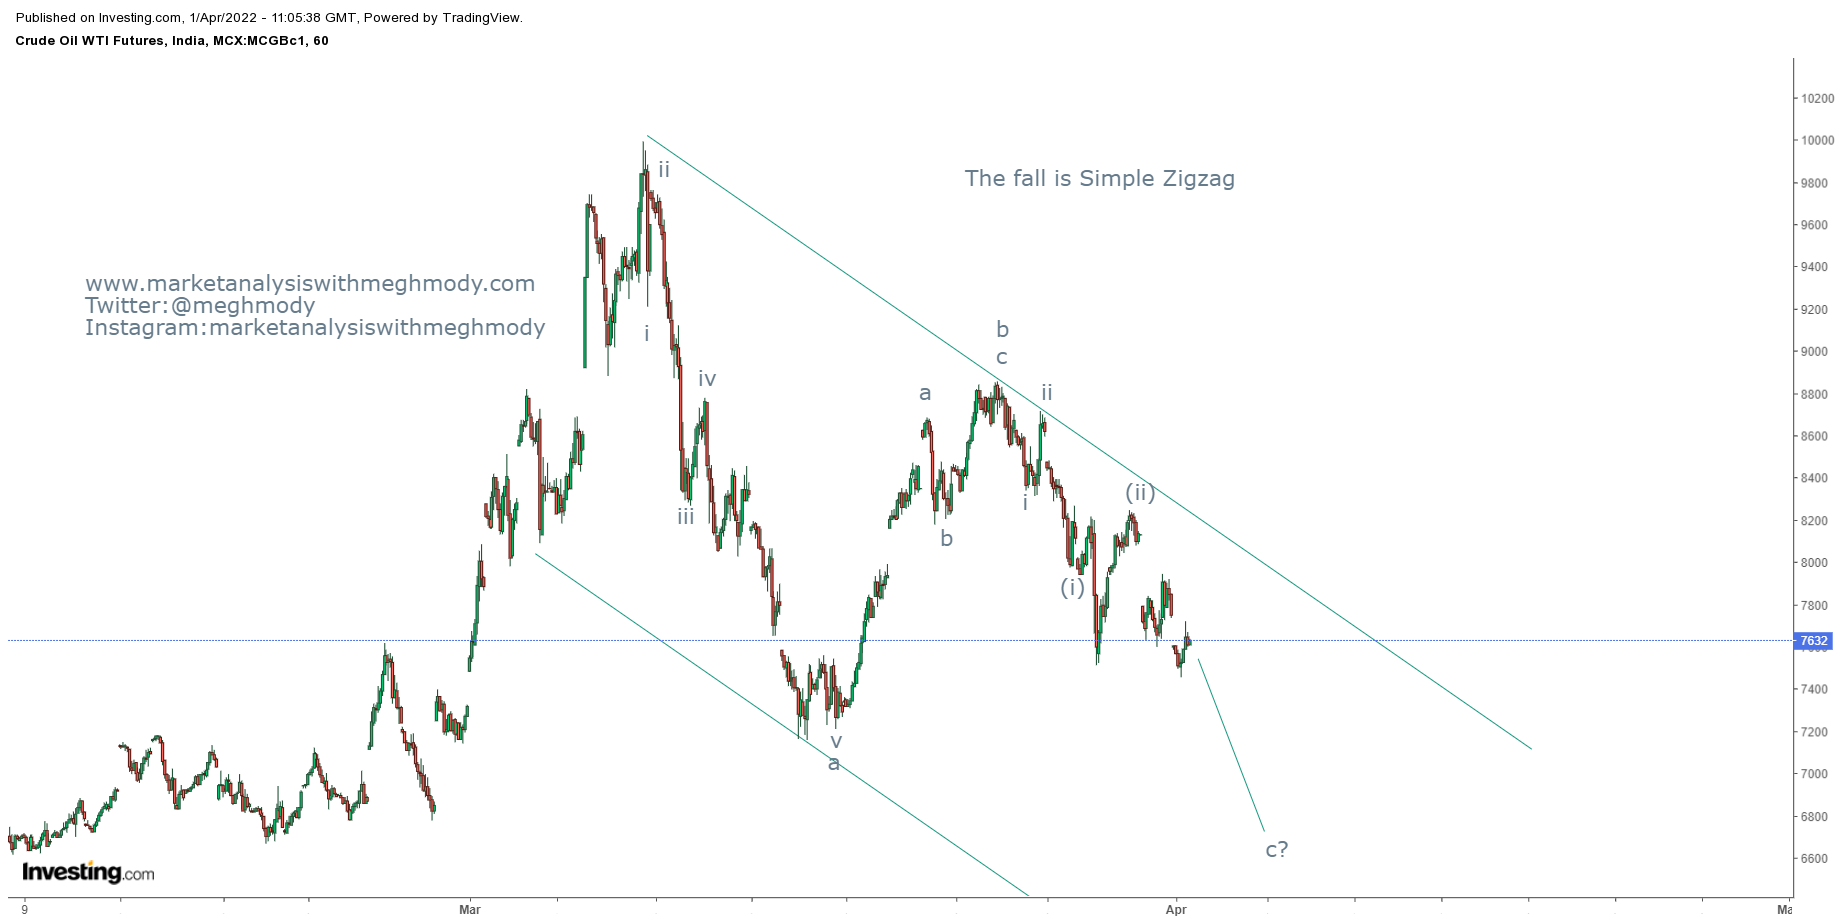
MCX Crude Oil 60 mins chart anticipated on 1st April 2022
MCX Crude Oil 60 mins chart happened on 11th April 2022
In my previous update on MCX Crude Oil, I had mentioned that, "MCX Crude Oil can test the level of 7155 followed by 6620 levels over short term."
I had given two targets in MCX Crude where the first one was achieved as it made a low of 7071 which was 61.8% of wave a to wave b. The second target was 161.8% of wave a to wave b where zigzags can be completed which it did not - Anticipated Happened
To view my previous article on MCX Crude Oil, you can click on the below link
https://www.marketanalysiswithmeghmody.com/2022/04/mcx-crude-oil-simple-zigzag-elliott.html
Prices plunged by over 7.30% in 7 trading sessions and then bounced from cluster of supports breaking the falling trend line resistance and also the falling wedge pattern, both indicates that downtrend is over.
As per wave theory, prices have completed wave a wave b and wave c in an ending diagonal pattern and is now moving up in form of new leg. This up move can face resistance near 7950-8000 levels.
The summation is MCX Crude Oil is set to soar near till 7950-8000 levels over short term.


Comments