MCX Natural Gas Elliott Wave Analysis
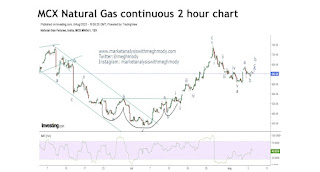
MCX Natural Gas has rallied till 760 levels and thereby it has started moving in a lower highs and lower lows formation. At present the energy segment has shown some resilience which has opened doors for it to test its previous high.
From 2 hour chart, prices after breaking the falling channel has shown strength, it is likely that prices are expected to test the level of 670 over short term. RSI is well above the center line which is a positive sign.
As per Wave theory, the fall from 760 looks impulsive and so I have marked it as wave a which was completed at 602 levels. After that it is moving in form of wave b where wave a of wave b and wave b of wave b is completed. It has just unfolded wave c of wave b.
The summation is MCX Natural Gas is likely to test the level of 670 with support at 627 (closing basis).


Comments