MCX Gold and Elliott Wave Counts
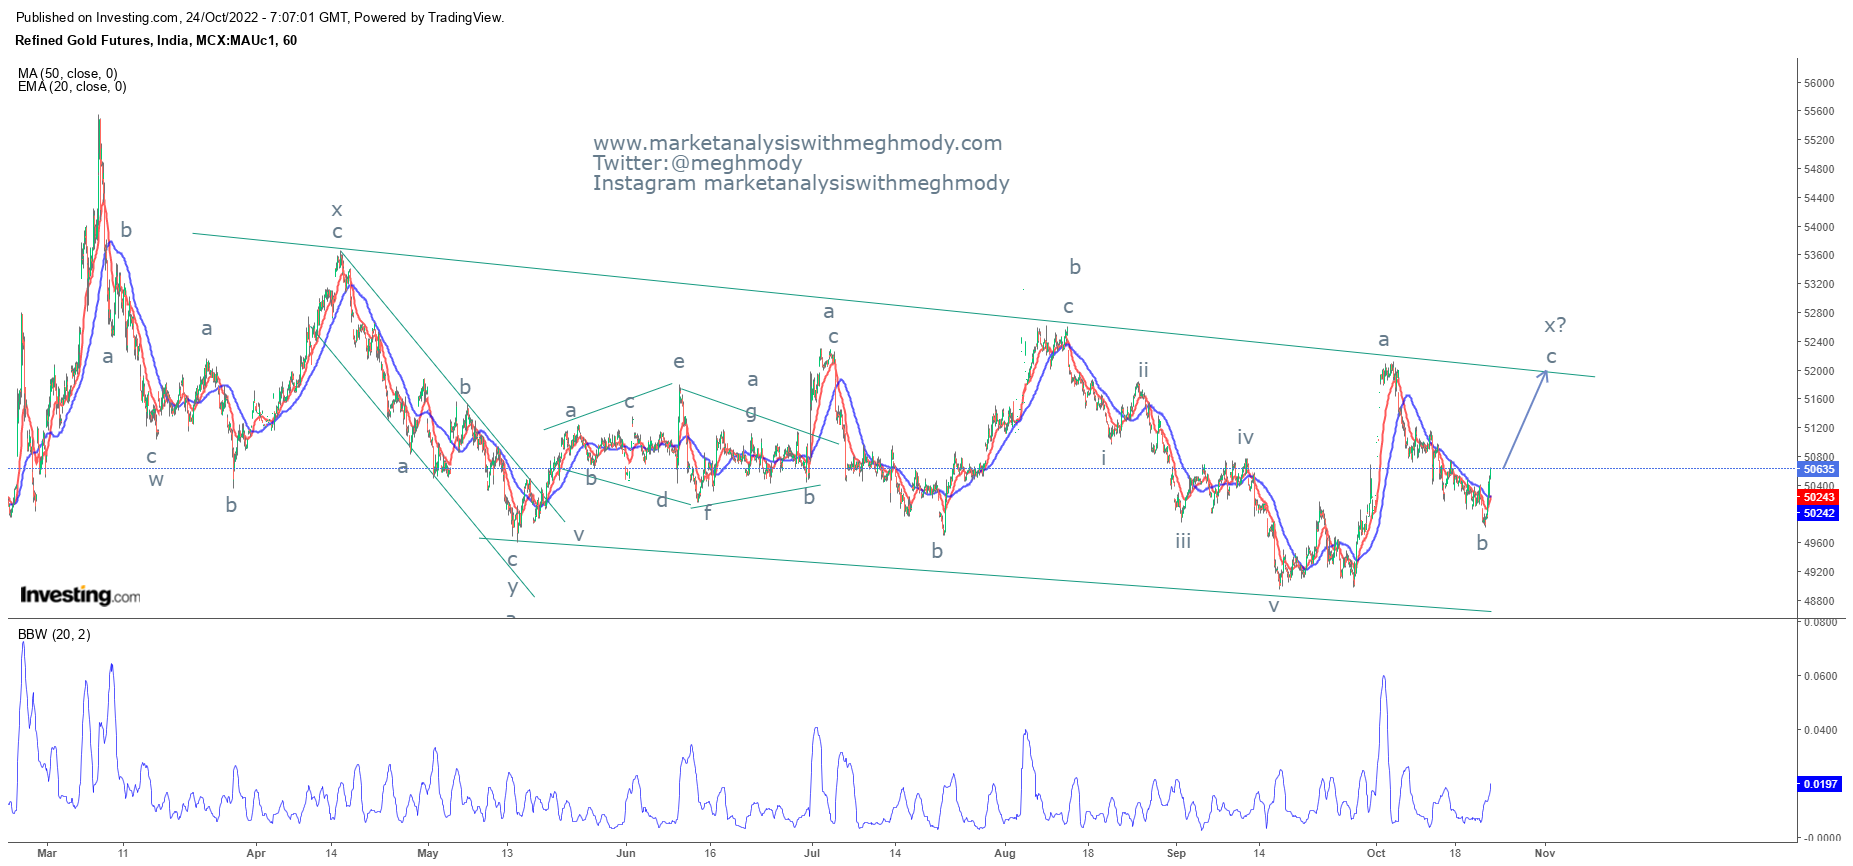
MCX Gold hourly continuous chart
Analysis
From the above
chart, MCX Gold has started picking up momentum after moving down from 52000 to
49600 levels. The yellow metal has now climbed above 50600 and can possibly
move or test the falling trend line which is placed at 51800 levels.
On the lower
panel I have placed Bollinger Width which indicates that the Band is expanding
as it moves higher from 0 levels. Every time it has started moving higher,
prices have shown good amount of rally.
As per wave
theory, the yellow metal is moving in double correction where it is currently
moving in wave c of wave x. Wave c is impulse in nature and can move near till
51800-52000 levels over short term.
The summation
is MCX Gold can test the levels of 51800-52000 over short term with support
placed at 49800 (closing basis).


Comments