US 10 Year Yields and Elliott Wave Analysis
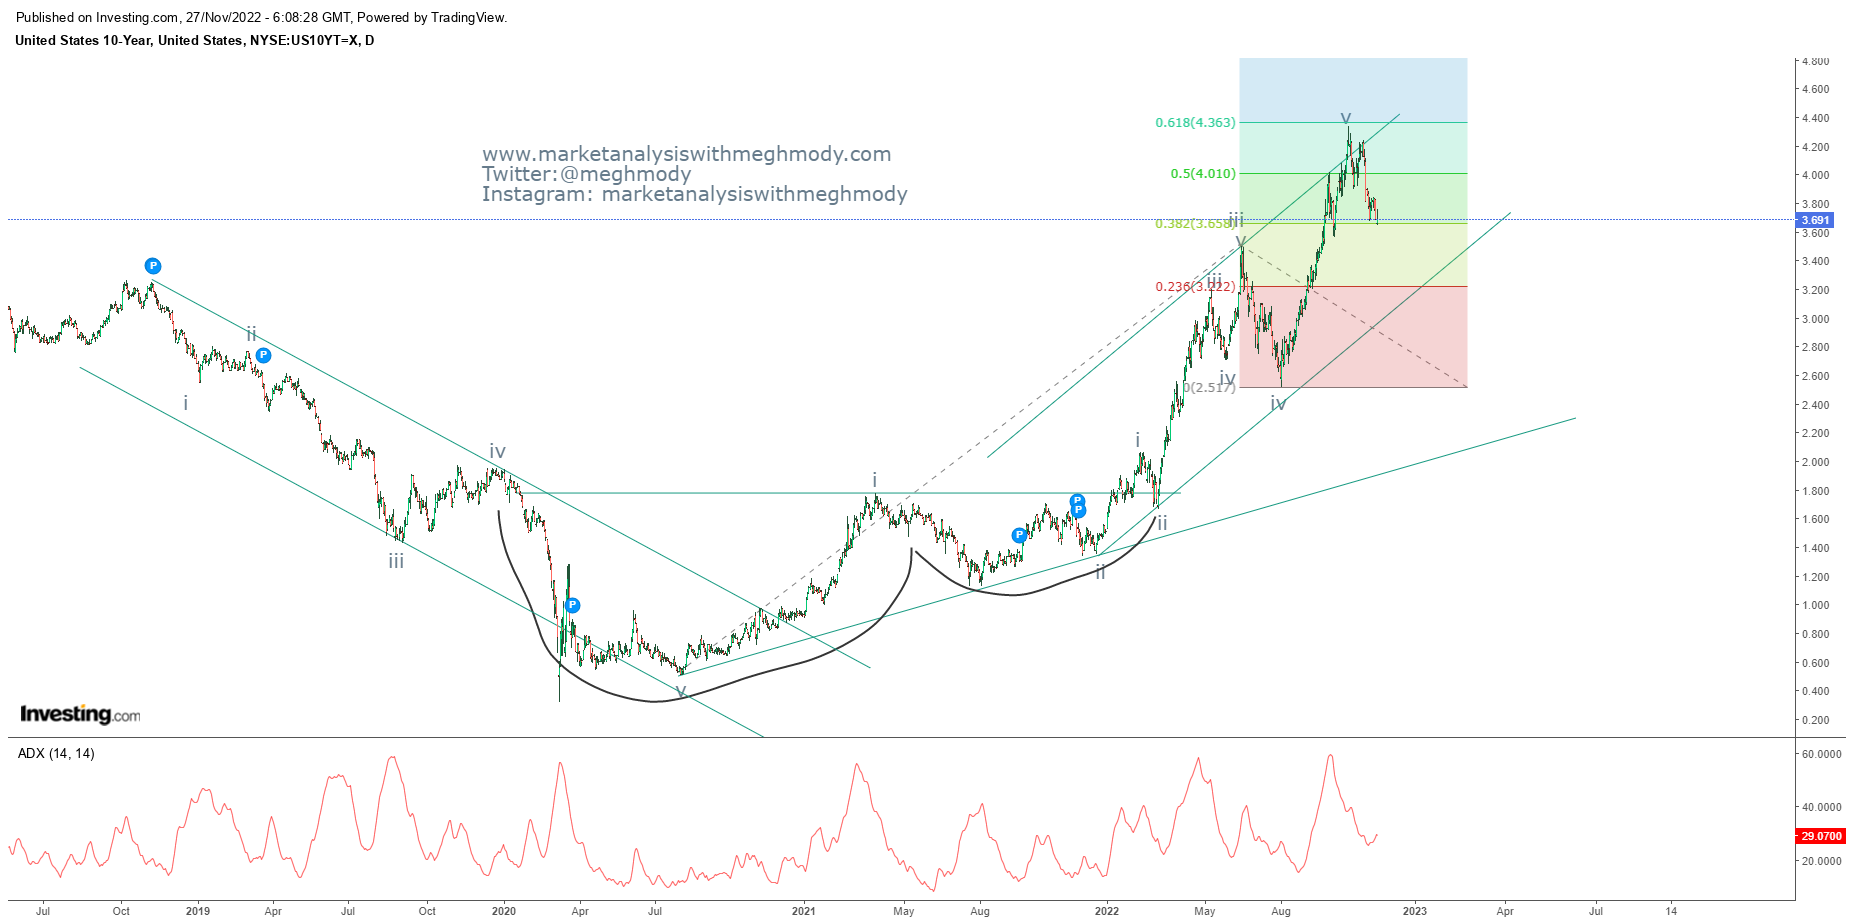
US 10 Year Yield daily chart
Analysis
As shown in the above
chart, US 10 year yield is moving in a higher highs and higher lows and it is
precisely moving in a rising channel. Recently it faced the resistance of the
channel and reversed, currently moving in a negative direction. It has also
breached its previous low of 3.68%, thus opening further negative possibilities.
A weak 10 year
benchmark yield supports riskier assets indicating good inflows in global
equities. The global equities has started picking up momentum in the last three
weeks on the back of weak yields.
ADX is also
indicating that the strength of the upward trend has subsided.
From Waves
perspective, Wave v has ended at 61.8% from wave 0 to iii added to iv thus
giving an indicating that the top has been in place. Prices are now moving in
opposite direction and has opened wave a on the downside which can move down
towards 3.55%
The summation is US
10 Year Yield is negatively poised and can move down towards its support placed
at 3.55% over very short term.


Comments