Posts

Showing posts from December, 2022

USDJPY : Revisited and Anticipated Happened

Image
 USDJPY daily chart anticipated on 12th November 2022 USDJPY daily chart happened on 19th December 2022 In my previous update I had mentioned for USDJPY that, " USDJPY has reversed from the top and can sink near till 132-130 levels over short term." When I was writing the article and anticipating that the pair can sink towards 132-130 levels at that time it was quoting at 138 levels. It then plunged towards the support area (shaded portion) and thereby achieving my mentioned level - Anticipated Happened. To view my article on USDJPY, click on the below mentioned link https://www.marketanalysiswithmeghmody.com/2022/11/dxyeurusdgbpusdusdjpy-elliott-wave.html The pair has fallen from the highs and marked a low of 130.5 levels, the fall was impulse and prices are all set now to open a counter wave in the form of wave ii or wave b. This will again open another leg on the downside. As of now prices are likely to climb above 136-139 range over short term. The summation is USDJPY is ...
Nifty Bank Elliott Wave Analysis

Image
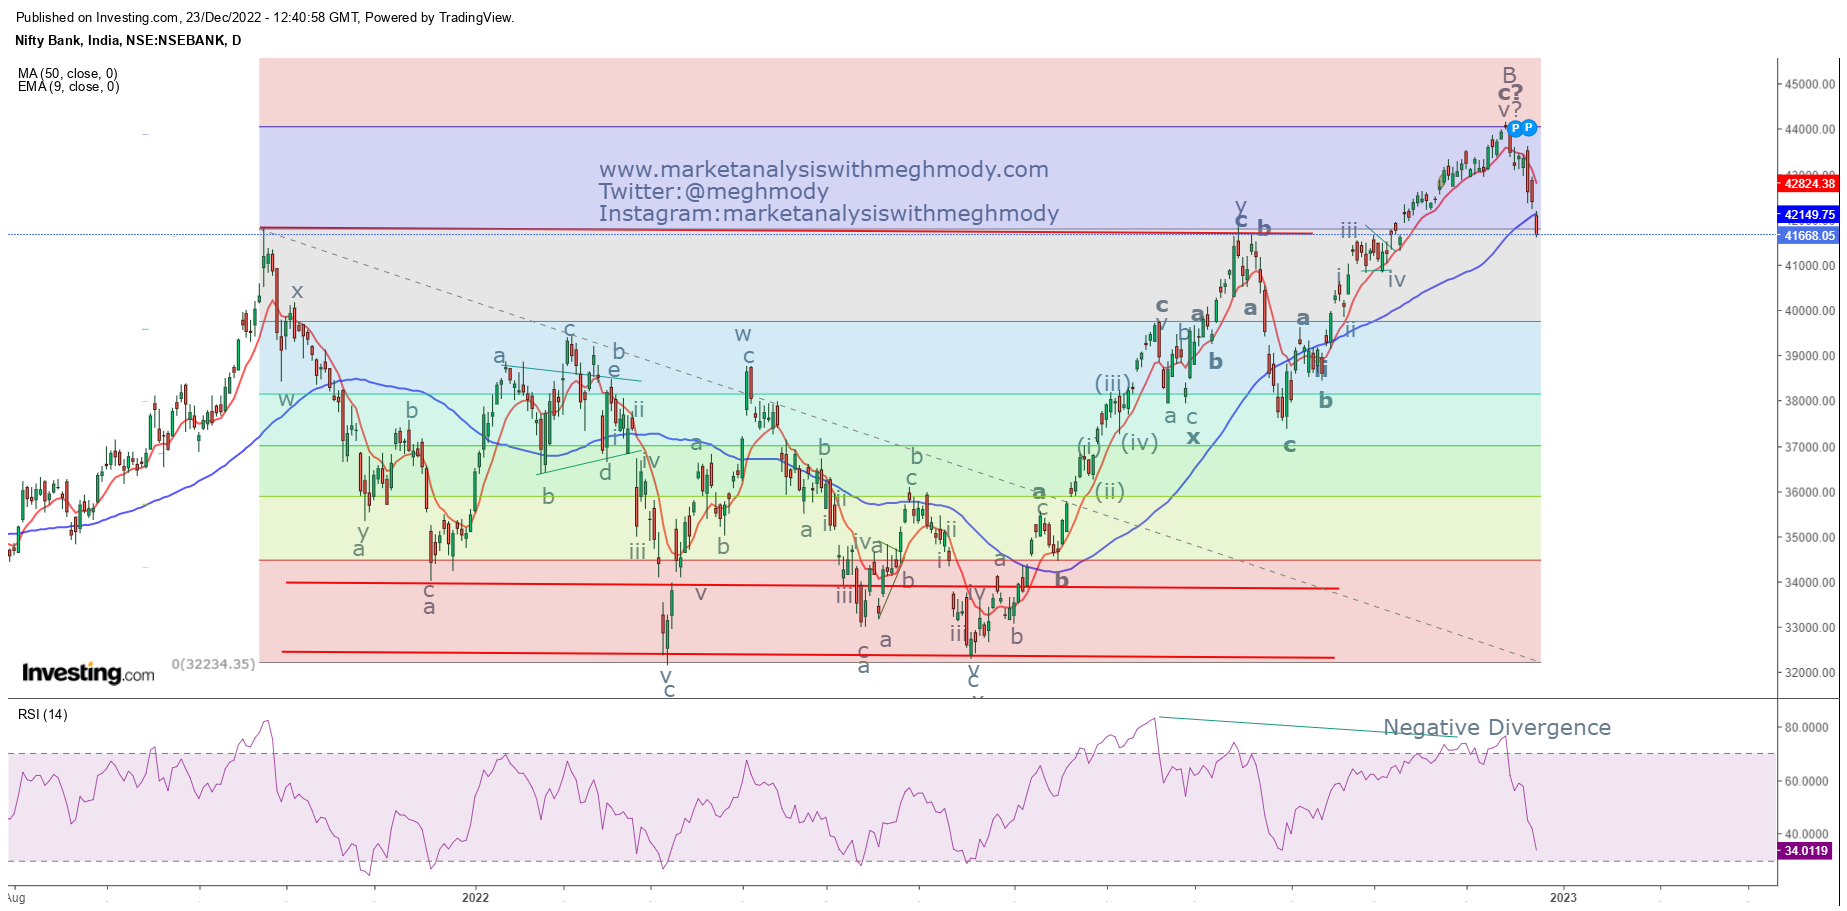
  Nifty Bank spot daily chart Analysis In my previous update I had mentioned that, “ Nifty Bank is likely to test 43400-43500 levels over short term and can again resume the major trend testing the levels of 42600 over medium term.” Nifty bank moved up as expected and tested the resistance of 43400-43500 levels making a high of 43610 and thereafter it plunged below the level of 42600, thus achieving my mentioned level – Anticipated Happened. As shown in the above daily chart, the benchmark has moved down below both the moving averages which is first indication of bearishness. However, RSI has arrived near to the oversold terrain and one can expect that the oscillator can relieve from the oversold terrain to make vacuum. An unfilled gap down move opens the possibility of breakaway gap. As seen in 2 hour chart, the index has arrived near multiple supports, first is the series of tops which was earlier acting as resistance now support (role reversal) (red horizontal line). Also the su...

Ethereum Elliott Wave Counts

Image
  Ethereum 4 hour chart Analysis Just like Bitcoin, Ethereum continues to move in a stealth downtrend which is a negative sign. The crypto is moving precisely in a falling red channel in a lower highs and lower lows. As per wave theory, prices are moving in a double correction pattern (a-b-c-x-a-b-c) in which wave b on the lower side is pending, once completed wave c on the higher side will start. The summation is Ethereum can falter towards $1100-$1000 over short to medium term.

Bitcoin - Ending Diagonal

Image
  Bitcoin 4 hour chart Analysis Bitcoin continues to move in a sideways direction but the movement is tilted as if accumulation is happening at lower levels. A tilted fall is to be cautious that the selling will not intensify. This pattern in common tongue is known as falling wedge and there is still no breakout occurring. The Relative Strength Index is exhibiting positive divergence as and when the wedge was forming. According to wave theory, prices might have completed wave iv and wave v on the lower side of ending diagonal is pending which can infuse selling pressure dragging prices towards $15200-$1500 levels over short term. The summation is Bitcoin will remain in a sideways to negative terrain and the level of $15200-$1500 is pending on the downside.

Axis Bank Elliott Wave Analysis

Image
  Axis Bank hourly chart Analysis From the above chart, prices are moving in a higher highs and higher lows and it is moving precisely in rising channel. As of now no previous lows is taken out and the banking stock is currently hovering near to the support. A bounce back from here is not ruled out. MACD is in sell mode and it is below the center line which is a negative sign. RSI has approached near to the oversold terrain and has the tendency to relieve from current levels. As per Waves perspective, prices are soaring in double zigzag pattern (a-b-c-x-a-b-c). It has recently completed wave c of second correction and fresh leg on the downside has started. The recent fall looks impulse and prices can bounce from here to test 920-930 levels which can be a selling opportunity. However, failure to protect the level of 896 can infuse selling pressure which can drag prices towards 870. The summation is Axis bank can bounce near till 920-930 levels which can can be utilized as a ...

CAC 40 Elliott Wave Analysis

Image
  CAC40 daily chart Analysis As seen in the above chart, prices are still moving in a lower highs and lower lows which is an indication that the bias is negative for the index. Also the index has arrived near to the resistance of the falling channel and can or has reversed which can open next leg on the downside. Bollinger Bands indicate that there is a break\out on the lower side after it has contracted thus opening negative possibilities. From Waves perspective, prices have completed wave b in irregular flat pattern (a-b-c).It has opened wave c lower which can go down till 5800 levels over short term which is 61.8% from wave a to wave b. The summation is CAC 40 can plunge towards 5800 over short to medium term with its resistance placed at 6780.

GBPINR Elliott Wave Counts

Image
  GBPINR spot 4 hour chart Analysis As shown above chart, the currency pair continues to move in a higher highs and higher lows and it is moving precisely in rising channel. It is important to see if prices break the level of 99 levels which will not only break the support of the channel but also will complete one higher degree of wave count. If the pair fails to break the important support then prices will continue to rise and can even move higher surpassing the level of 102.4. As per wave theory, if prices fail to break 99 levels then wave v will be extended and prices will continue to soar. Failure to do so will open negative possibilities and the pair can touch 97 levels. The summation is GBPINR needs to break the level of 99 which can drag prices near till 97 levels. If it fails and climbs above 101.3 then there are high chances for it to even climb beyond 102.4 levels.

MCX Silver and Elliott Wave Counts

Image
  MCX Silver daily continuous chart Analysis In the above daily chart, prices continue to move in a higher highs and higher lows and has arrived near to a minor resistance, prices can reverse from current levels and might arrive near to 67500 levels. This fall can be utilized as a buying opportunity. ADX is clearly indicating that the positive trend is very strong and shown immense strength going ahead. As per wave theory, prices might have completed wave iii and can move down in the form of wave iv ending near to 67500-67300 levels and thereafter it can move towards 70000 in form of wave v. The summation is MCX Silver can dip towards 67500-67300 price range which can be utilized as a buying opportunity for the level of 70000 levels.

MCX Crude Oil Elliott Wave Analysis

Image
  MCX Crude Oil 4 hour continuous chart Analysis In the above daily chart, prices continue to move in a lower highs and lower lows which is a negative sign. Also the commodity is moving precisely in a falling red channel thus indicating that there can be more downside left. MACD is giving a signal of sell as the osc has cut the trigger line from above. However, advance technical open one leg higher before it falls to a new low. As per wave theory, if the current has ended (assumption), then wave c has not even retraced 61.8% of wave a to wave b, thus I think that wave c will continue to move down and has completed wave i at 5840 followed by wave ii higher which is ongoing and can test 6500-6600 range. The summation is MCX Crude Oil is all set to move towards 6500-6600 price range before major fall starts.

Hang Seng Anticipated Happened

Image
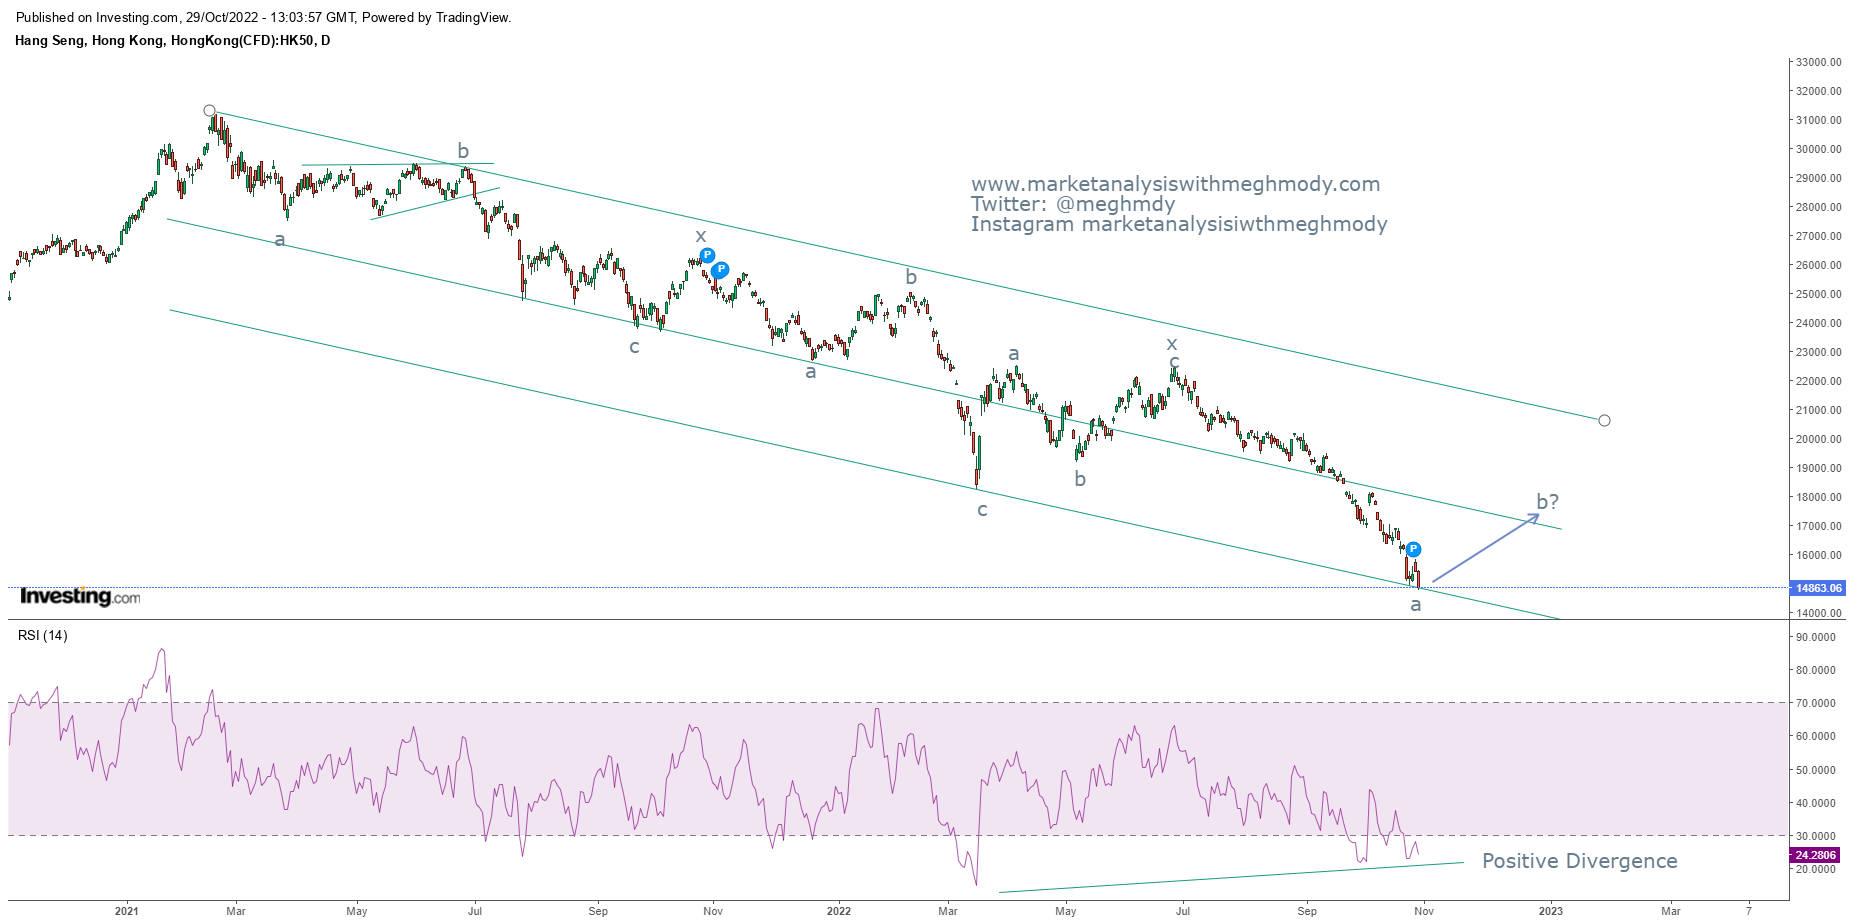
  Hang Seng daily chart Anticipated on 29 th  October 2022 Hang Seng daily chart happened on 11 th November 2022 Analysis In my previous update on Hang Seng dated on 30 th October 2022, I had mentioned that, “ Hang Seng can start a counter trend which can surge prices near till 16800-17000 levels over medium term .” The index climbed above 17000 thereby achieving my mentioned level of 16800-17000– Anticipated Happened. To view my previous article on Hang Seng, please click on the below mentioned link https://www.marketanalysiswithmeghmody.com/2022/10/hang-seng-elliott-wave-analysis.html As seen in the above chart, prices rallied from the support of the channel and has approached towards its resistance. There can be limited upside still left but it will be short lived. For a reversal to happen, it is important that prices break the level of 18800 which can drag prices towards 14200 levels. RSI has arrived near to the overbought terrain, as far as the lower highs and low...

USDINR and Ending Diagonal

Image
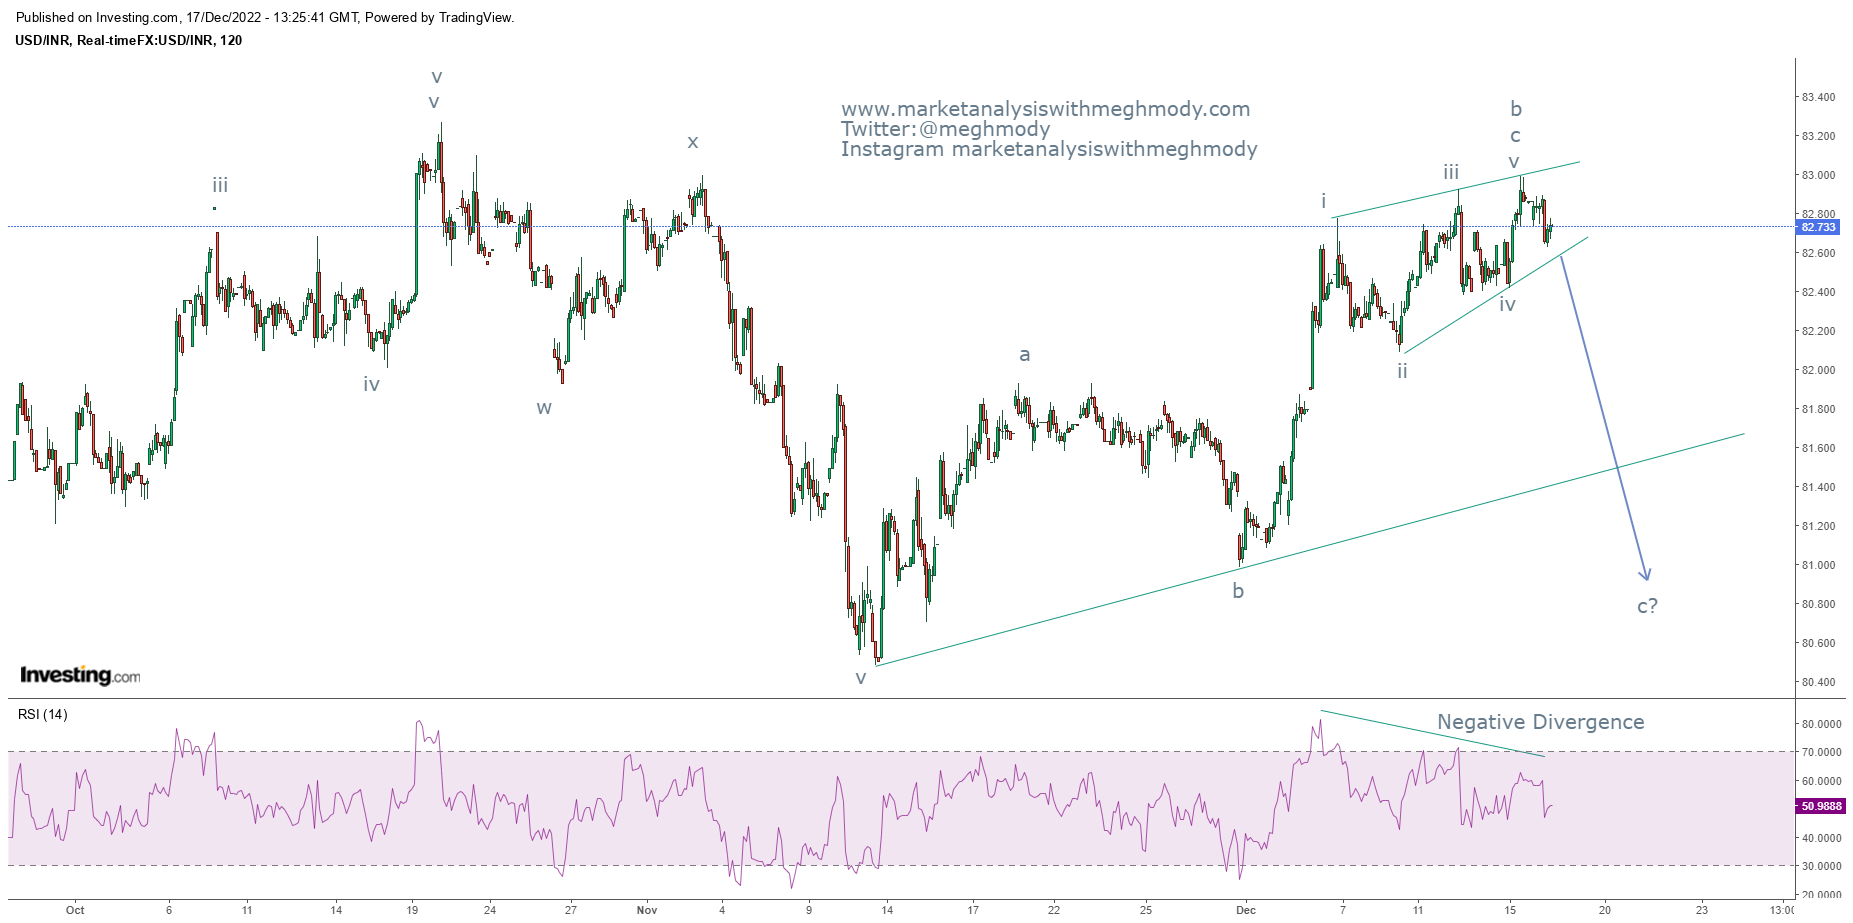
  USDINR spot hourly chart Analysis As shown above chart, USDINR continues to move in a sideways direction with a slight tilt in price action. This tilt in common technical terms is formed into a pattern known as rising wedge. The rising wedge has accompanied with negative divergence in RSI indicating that the upside is halted. My view in continues to remain negative but the targets will be revised. Rising wedges often gives a negative breakout, it is likely that the pair will move down once the level of 82.5 is broken which will infuse selling pressure dragging prices towards 81.8 ort term. It is imperative that pair breaks 81.6 which can accelerate more selling in this pair. As per wave theory, prices have now completed wave b in which wave c has formed an ending diagonal pattern. A break below 82.50 will confirm that wave c of one higher degree of flat pattern has started. The summation is USDINR is all set to plunge and test 81.8 over short term followed by 80.6, only i...

Nifty Anticipated Happened and Elliott Wave Analysis

Image
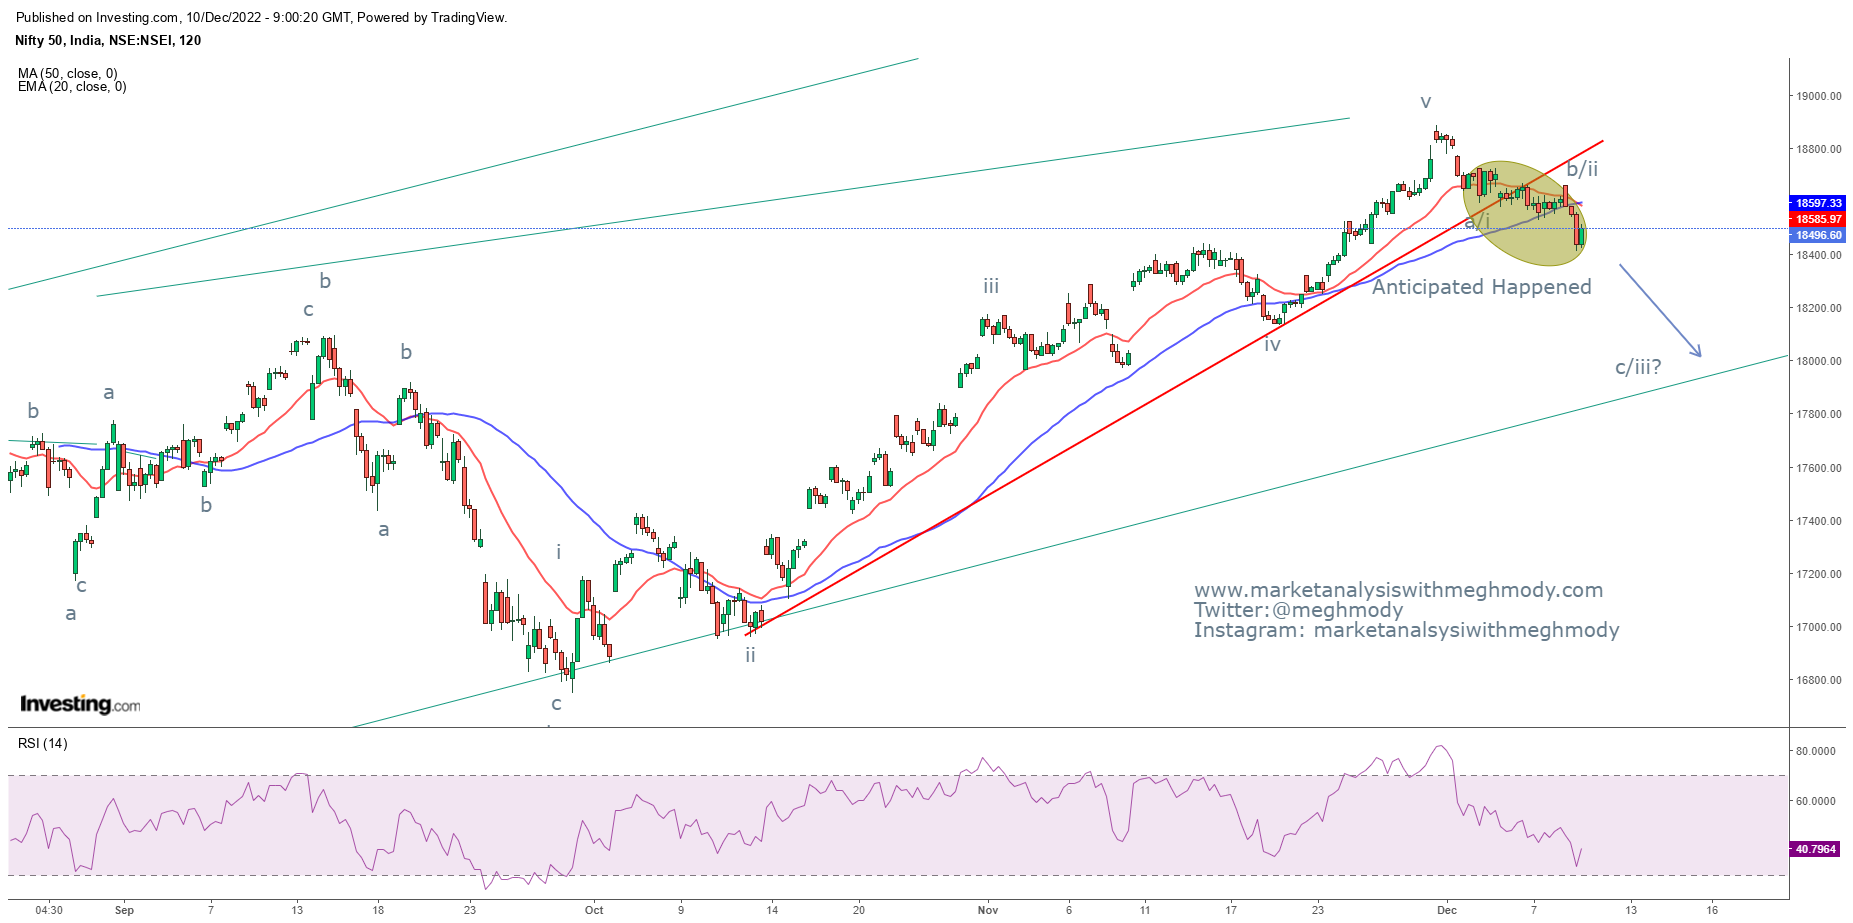
 Nifty 2 hour chart  Analysis In my previous update dated 5 th Dec I had mentioned, “ Nifty possibly can reverse from current levels and test the support of 18450-18400 levels over short term. The resistance will be placed at 18900 (closing basis).” The index made a low of 18410 which was marked on the last day of the week, thereby achieving my level – Anticipated Happened To read my previous article on Nifty, click on the below link https://www.marketanalysiswithmeghmody.com/2022/12/nifty-and-elliott-wave-analysis.html From daily chart, the index continues to be above both the moving averages and it indicates that the trend is still positive. Any move above 18600 will open further positive possibilities and can push prices above the previous high. However, a move below 18400 can drag prices near to 18200 followed by 18050 levels. MACD continues to give a sell signal with negative divergence. In 2 hour chart, Nifty has broken the trend line support (red) and it is bel...

MCX Copper : Elliott Wave 5 on the move

Image
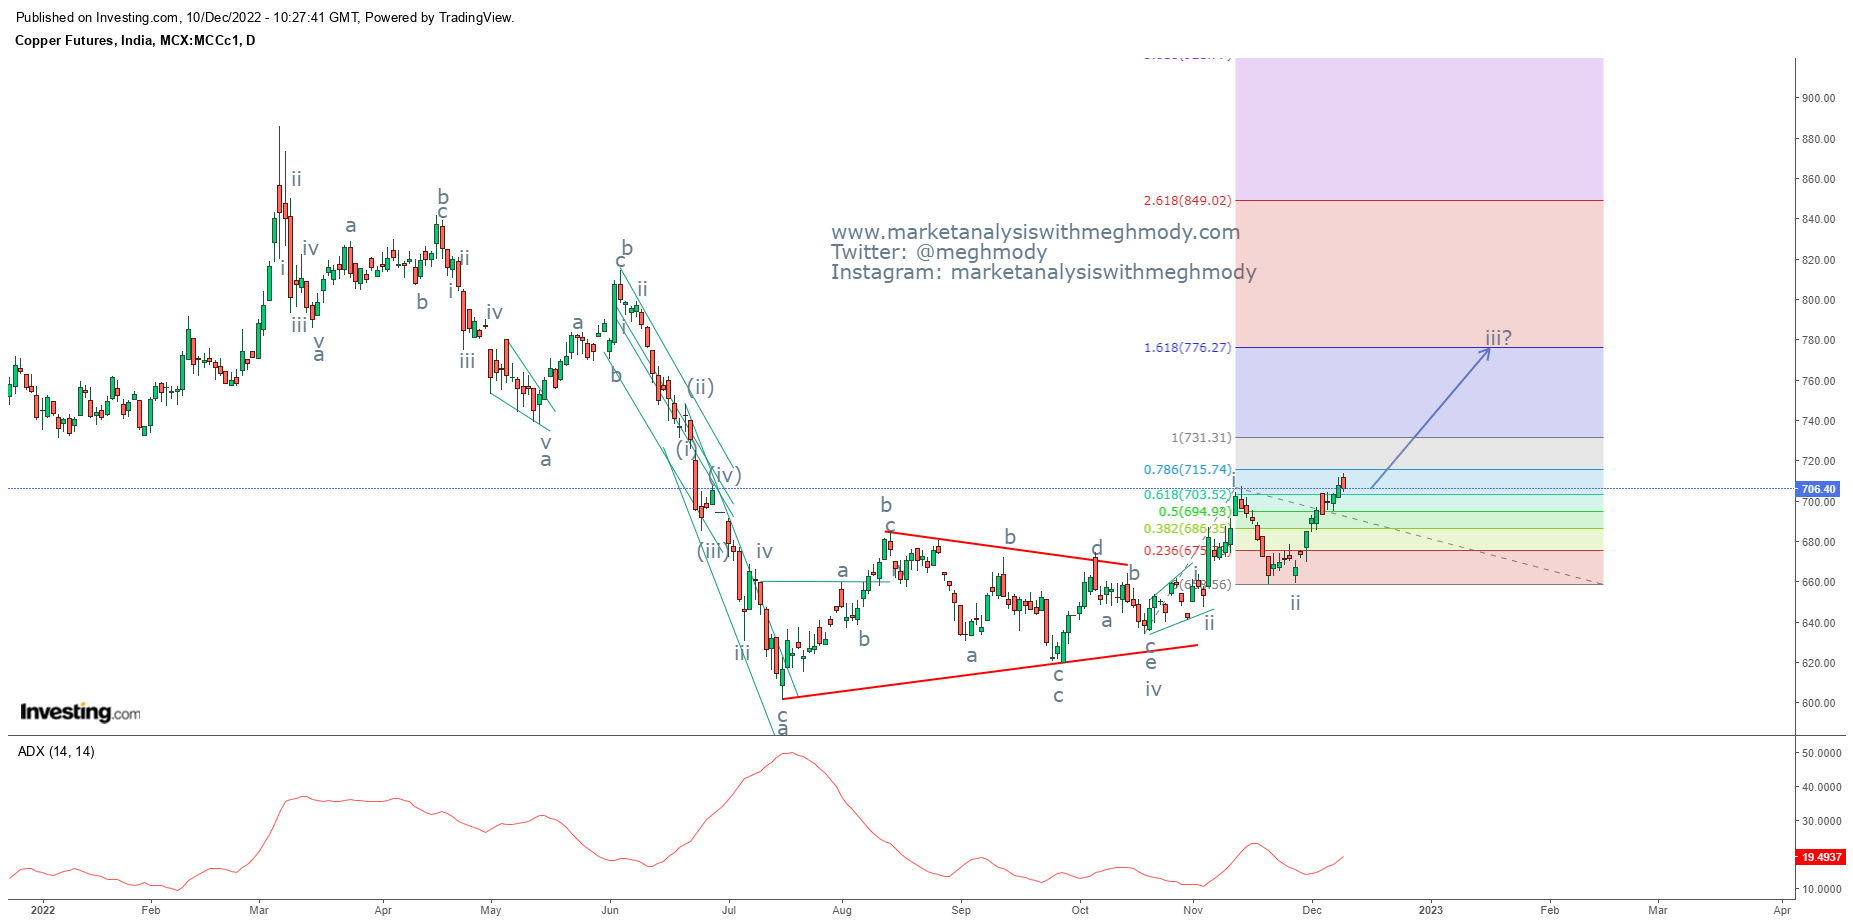
 MCX Copper daily continuous chart Analysis In the above daily chart, prices continue to move in a higher highs and higher lows after coming out from the consolidation zone. There is a high possibility for prices to move higher from current levels which can attempt to reach its preceding high. ADX has started moving higher. However, the strength is still not seen but once it moves above 20 then the trend will show immense strength. As per wave theory, prices completed wave iv of higher degree in a symmetrical triangle pattern. It has now opened wave v of wave iii which can go till 770-776 levels. The summation is MCX Copper is set to move in a positive direction and can test the level of 770-776 over short term.

US 10 year yield - Anticipated Happened

Image
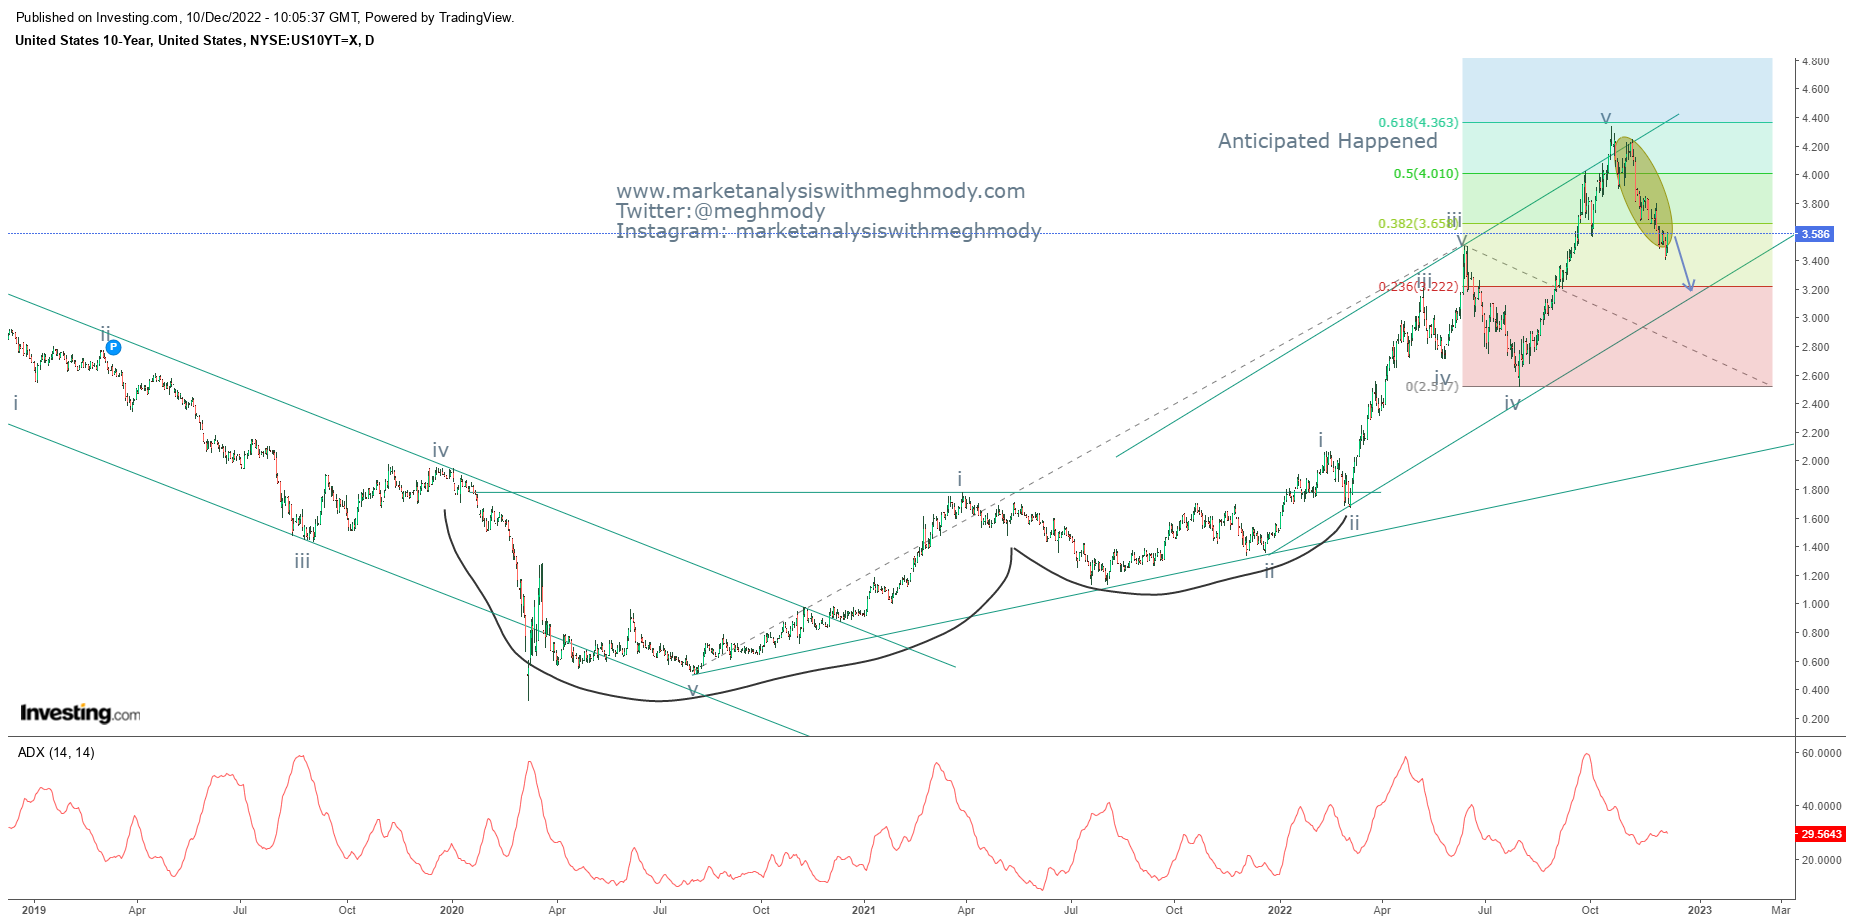
 US 10 year yield daily chart Analysis In my previous update on US 10 Year yield updated on 27 th November 2022, I had mentioned that, “ US 10 Year Yield is negatively poised and can move down towards its support placed at 3.55% over very short term.” The yield plunged below 3.55 thereby achieving my mentioned level– Anticipated Happened. T o see my previous article on 10 year yield , click on the below link https://www.marketanalysiswithmeghmody.com/2022/11/us-10-year-yields-and-elliott-wave.html As seen in the above chart, the yield has started moving in the opposite direction and continues to persist in the rising channel. It is imperative to see if it plunges near till the support of the channel which is placed near to 3.20% ADX is showing strength as it is above 25 thereby indicating that the trend is showing strength. From Waves perspective, the current fall is a part of wave a and can move down further till 3.20% The summation is US 10 year yield is negatively p...

USDINR Elliott Wave Analysis

Image
 USDINR spot 2 hour chart Analysis As shown above chart, USDINR is moving in a sideways terrain primarily moving in a range of 83-80 levels. Prices are expected to move in this range as it has attempted to move close to 83 levels but failed to cross it. So now there is a high possibility that the currency pair is likely to test the lower levels soon. RSI is close to overbought terrain and can move down as there is enough vacuum left for the oscillator to move down. As per wave theory, prices have completed wave b in a flat pattern (a-b-c) where wave b has retraced move than 80%, which will now open wave c lower. There is a high possibility for wave c to completely retrace all of wave b so it is likely that 80.50-80.30 levels will be tested. The summation is USDINR is all set to plunge and test 80.50-80.30 range over short to medium term.

Nifty and Elliott Wave Analysis

Image
Nifty spot daily chart Nifty spot 2 hour chart Analysis From daily chart, I think there can be halt in the up move for the index and the primary reason behind this is Evening star which was made on Thursday followed by confirmation on Friday indicating that there can be profit booking happening at the top. RSI has been continuously exhibiting negative divergence which was a sign of caution. In 2 hour chart, Nifty has not only shown negative divergence in MACD but has given a fresh sell signal thus opening negative possibilities. Prices currently are at the support of the moving average and once broken can slump towards 18450-18400 levels over short term. As per Wave theory, It looks like prices have completed wave v of wave c and can reverse the direction soon to unfold next leg. The summation is Nifty possibly can reverse from current levels and test the support of 18450-18400 levels over short term. The resistance will be placed at 18900 (closing basis).

MCX Aluminum and the road ahead

Image
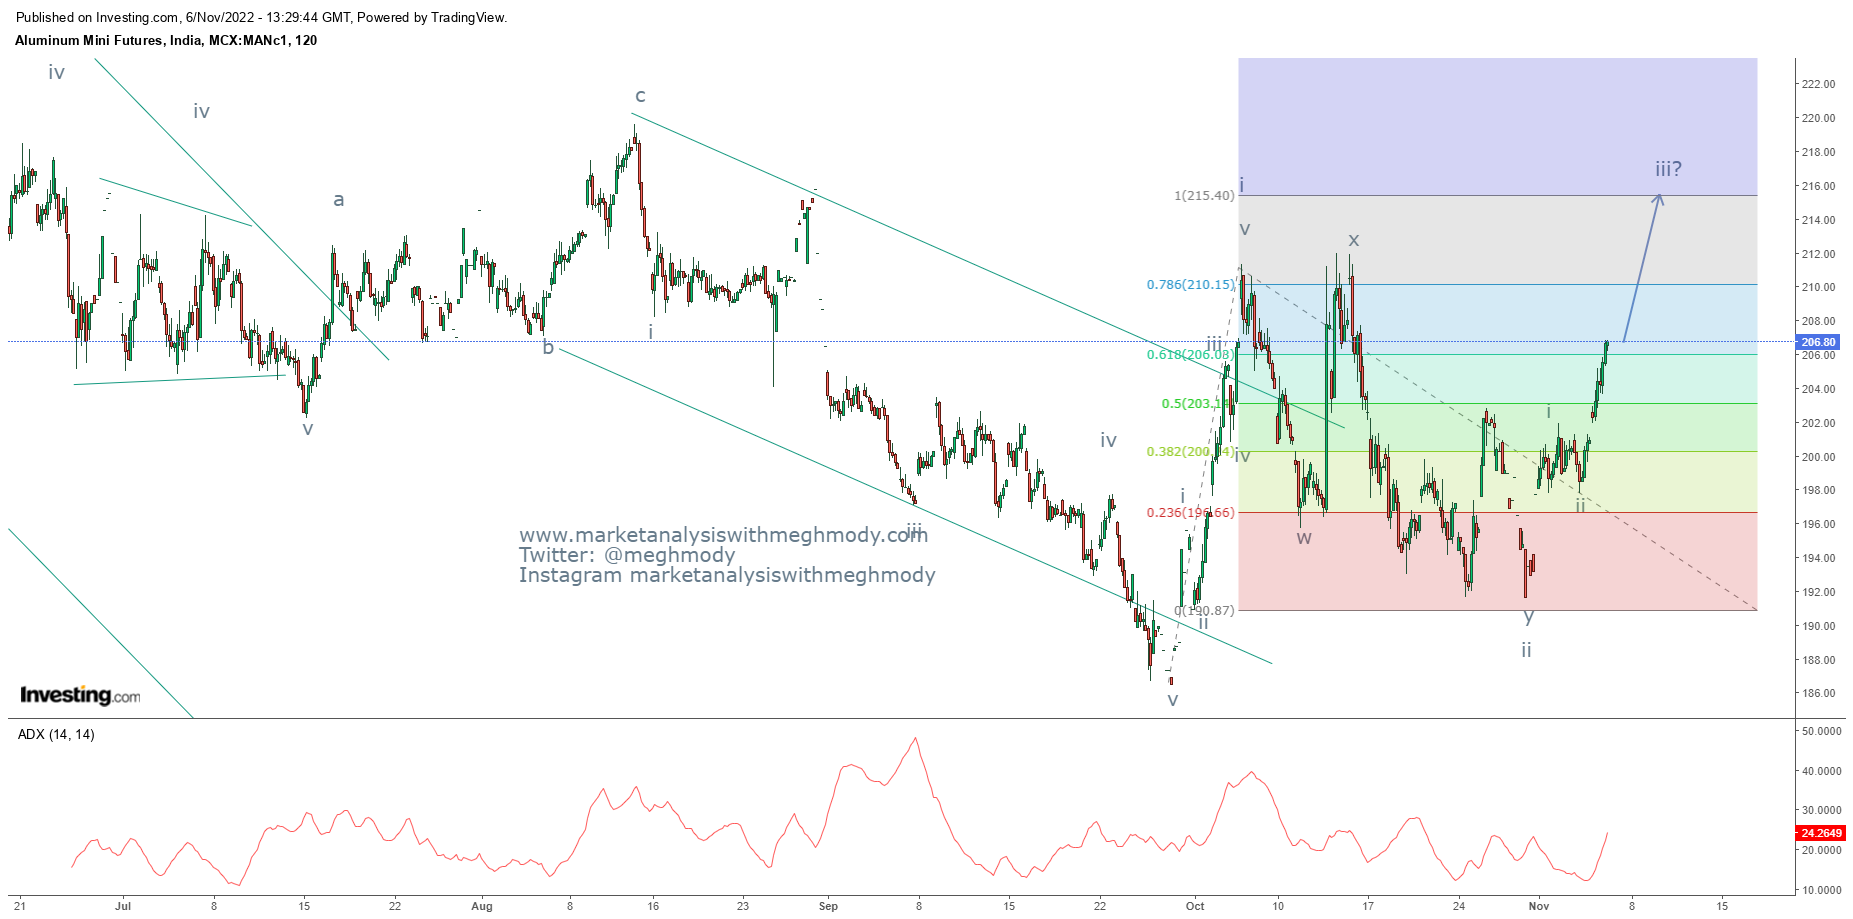
  MCX Aluminum 2 hour continuous chart anticipated on 6 th November 2022 MCX Aluminum 2 hour continuous chart happened on 2 nd December 2022 Analysis In my previous update on MCX Aluminum I had mentioned that, “ MCX Aluminum is positively poised and can move till 215-220 range over short term with support placed at 198 (closing basis). ” The base metal reached my resistance zone of 215-220 levels by marking a high of 216 levels – Anticipated Happened. To view my previous article on MCX Aluminum, click on the below link https://www.marketanalysiswithmeghmody.com/2022/11/mcx-aluminum-revisited-and-elliott-wave.html From the above chart, MCX Aluminum continues to transcend its previous high thereby giving a positive sign. The metal is expected to move towards its next resistance placed at 224 levels over short term. However, RSI is in overbought terrain. As per wave theory, prices are moving in wave iii which is extended in which wave i is expanding leading diagonal followed by wave...

Nikkei 225 - Revisited

Image
 Nikkei 225 daily chart anticipated on 6th November 2022 Nikkei 225 daily chart happened on 24th November 2022 Analysis In my previous update on Nikkei 225 updated on 7 th November 2022, I had mentioned that, “ Nikkei 225 is positively poised can move near till 28000-28400 resistance zone over short term.” The index started moving higher as anticipated and made a high of 28500 on 24 th November 2022 – Anticipated Happened. To read my previous article on Nikkei 225 click on the below link https://www.marketanalysiswithmeghmody.com/2022/11/nikkei-225-elliott-wave-analysis.html As seen in the above chart, the index reversed from the trend line resistance and has started moving down. Prices have also broken its previous low of 27773, this has opened negative possibilities which can slump prices going ahead. From Waves perspective, prices are in the last leg of diametric pattern (a-b-c-d-e-f-g) which means after completing wave f higher near to 28500, prices has opened wave g ...