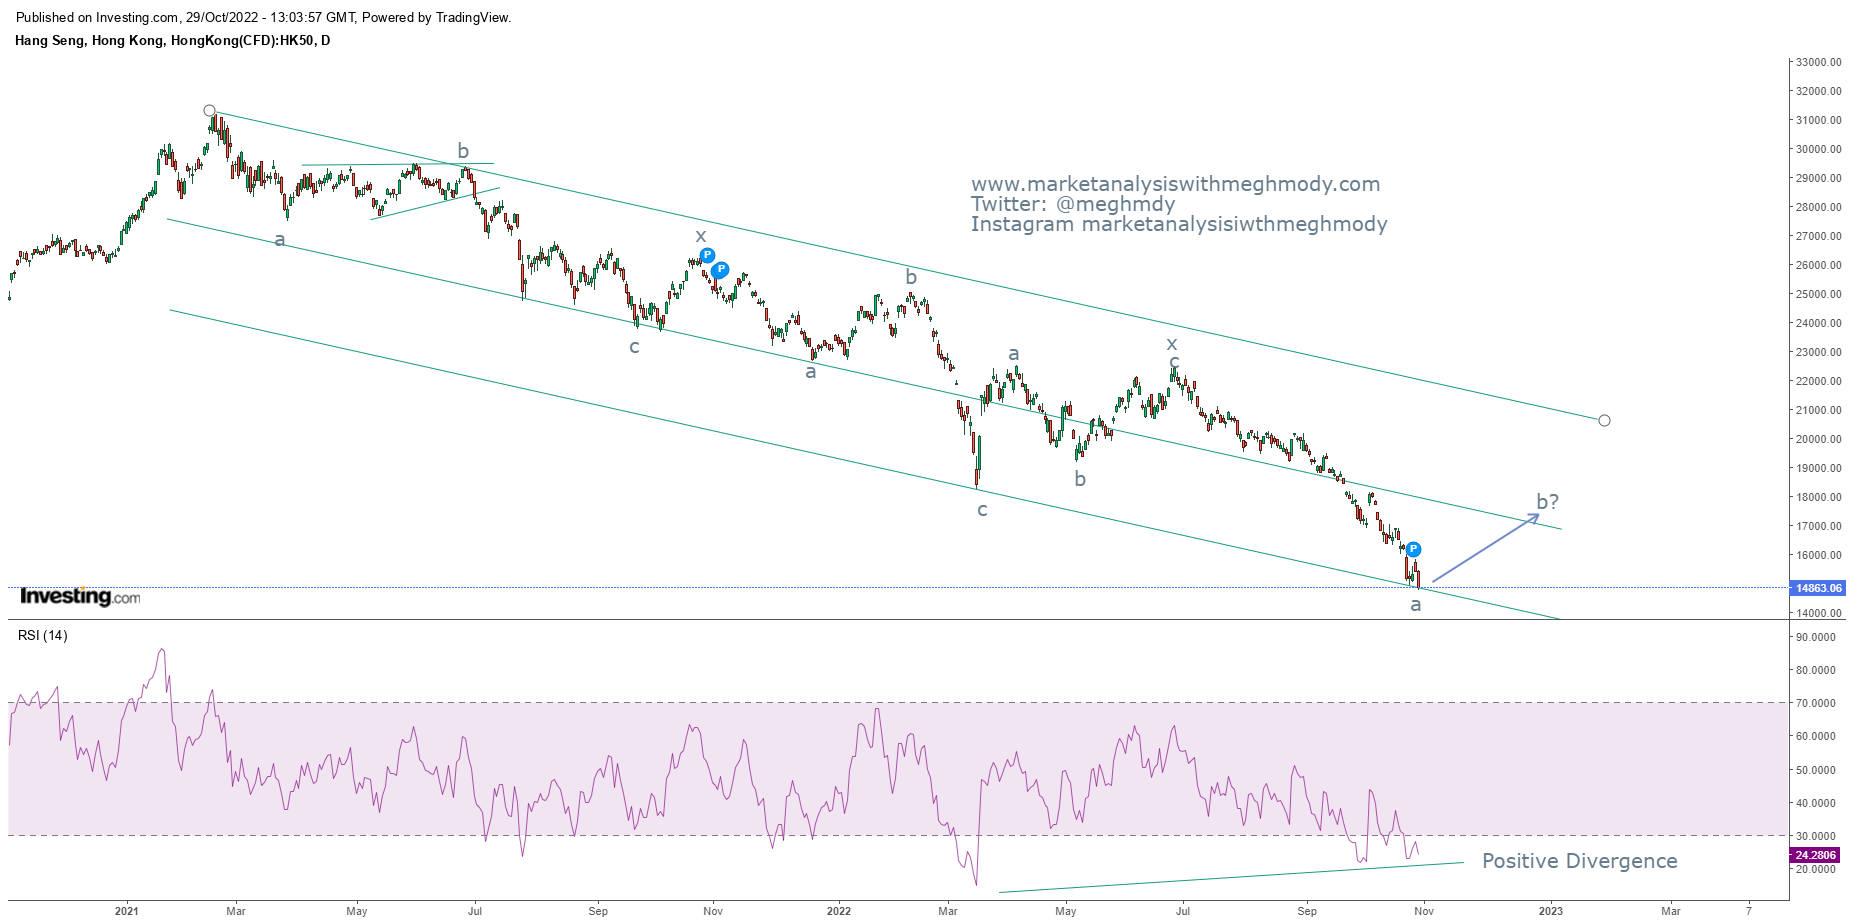
Hang Seng Anticipated Happened
Hang Seng daily chart Anticipated on 29th October 2022
Hang
Seng daily chart happened on 11th November 2022
Analysis
In my previous update
on Hang Seng dated on 30th October 2022, I had mentioned that, “Hang
Seng can start a counter trend which can surge prices near till 16800-17000
levels over medium term.”
The index climbed
above 17000 thereby achieving my mentioned level of 16800-17000– Anticipated
Happened.
To view my previous article on Hang Seng, please click on the below mentioned link
https://www.marketanalysiswithmeghmody.com/2022/10/hang-seng-elliott-wave-analysis.html
As seen in the above
chart, prices rallied from the support of the channel and has approached towards
its resistance. There can be limited upside still left but it will be short
lived. For a reversal to happen, it is important that prices break the level of
18800 which can drag prices towards 14200 levels.
RSI has arrived near
to the overbought terrain, as far as the lower highs and lower lows are intact,
RSI will not sustain above overbought terrain.
From Waves
perspective, prices are on the brink to complete wave b in a zigzag pattern,
where wave c of wave b has tested 78.6% of wave a to wave b of wave b which
means there are chances of reversal anytime soon to open wave c on the downside
of triple correction (a-b-c-x-a-b-c-x-a-b-c)
The summation is Hang
Seng needs to break the level of 18800 which can plunge the index towards 14200
levels.


Comments