MCX Copper : Elliott Wave 5 on the move
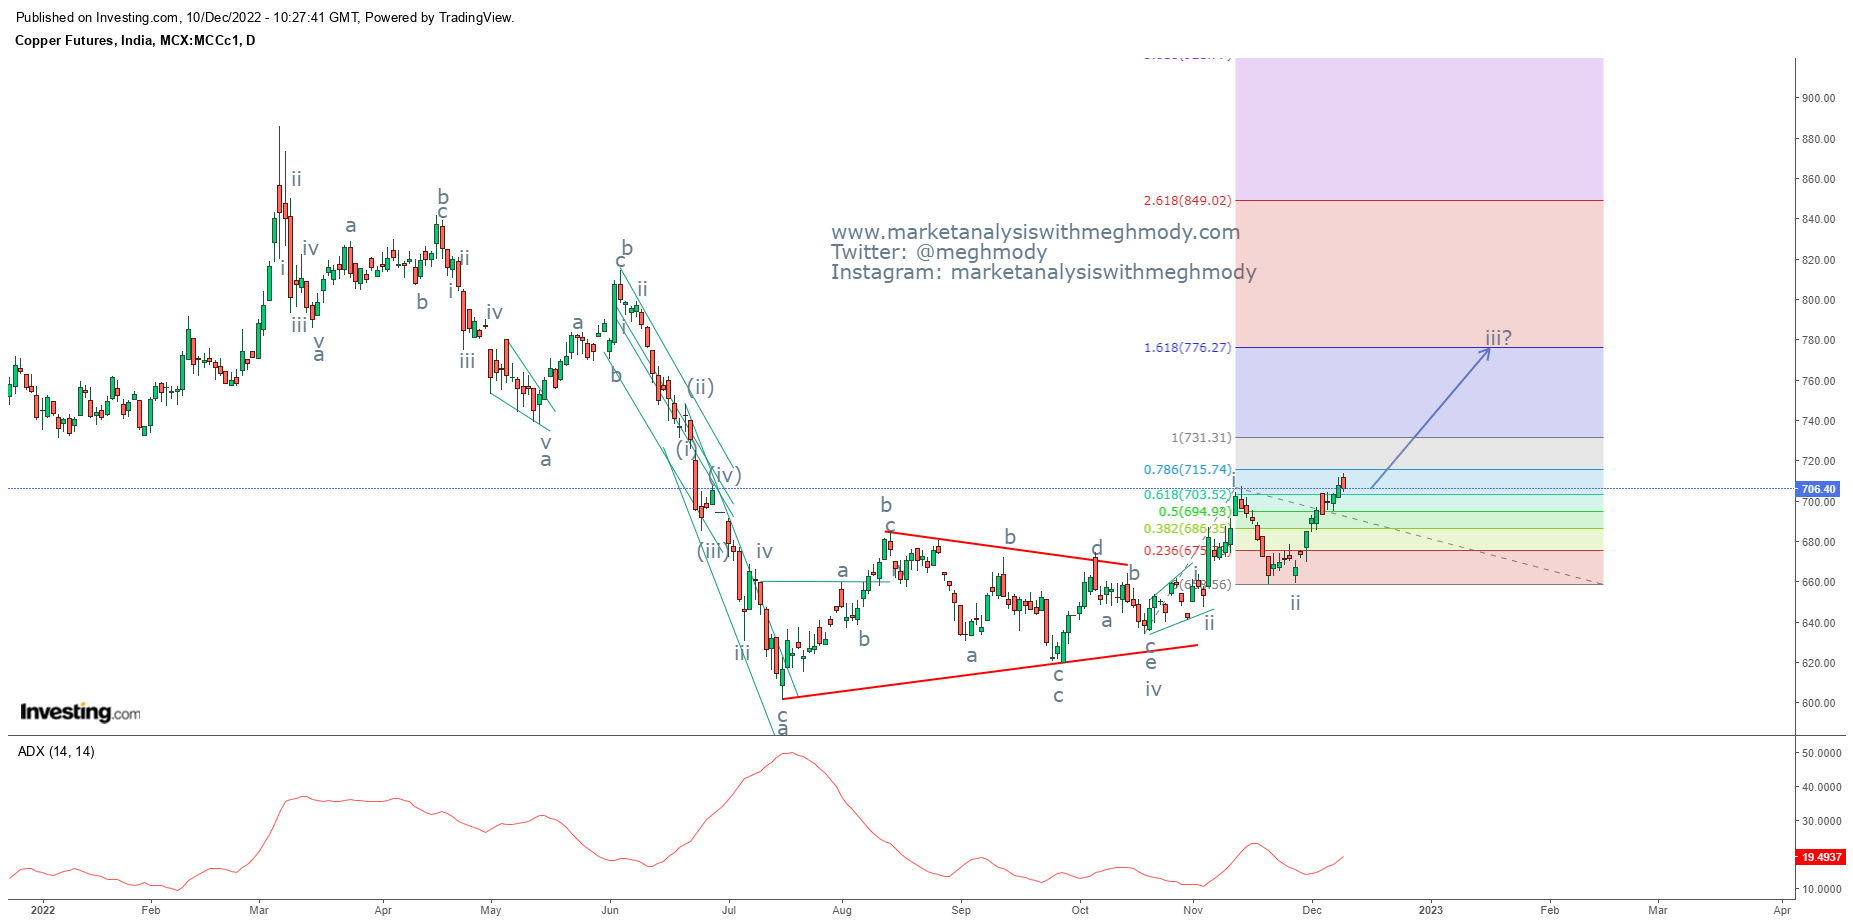
MCX Copper daily continuous chart
Analysis
In the above
daily chart, prices continue to move in a higher highs and higher lows after
coming out from the consolidation zone. There is a high possibility for prices
to move higher from current levels which can attempt to reach its preceding
high.
ADX has
started moving higher. However, the strength is still not seen but once it
moves above 20 then the trend will show immense strength.
As per wave
theory, prices completed wave iv of higher degree in a symmetrical triangle
pattern. It has now opened wave v of wave iii which can go till 770-776 levels.
The summation
is MCX Copper is set to move in a positive direction and can test the level of
770-776 over short term.


Comments