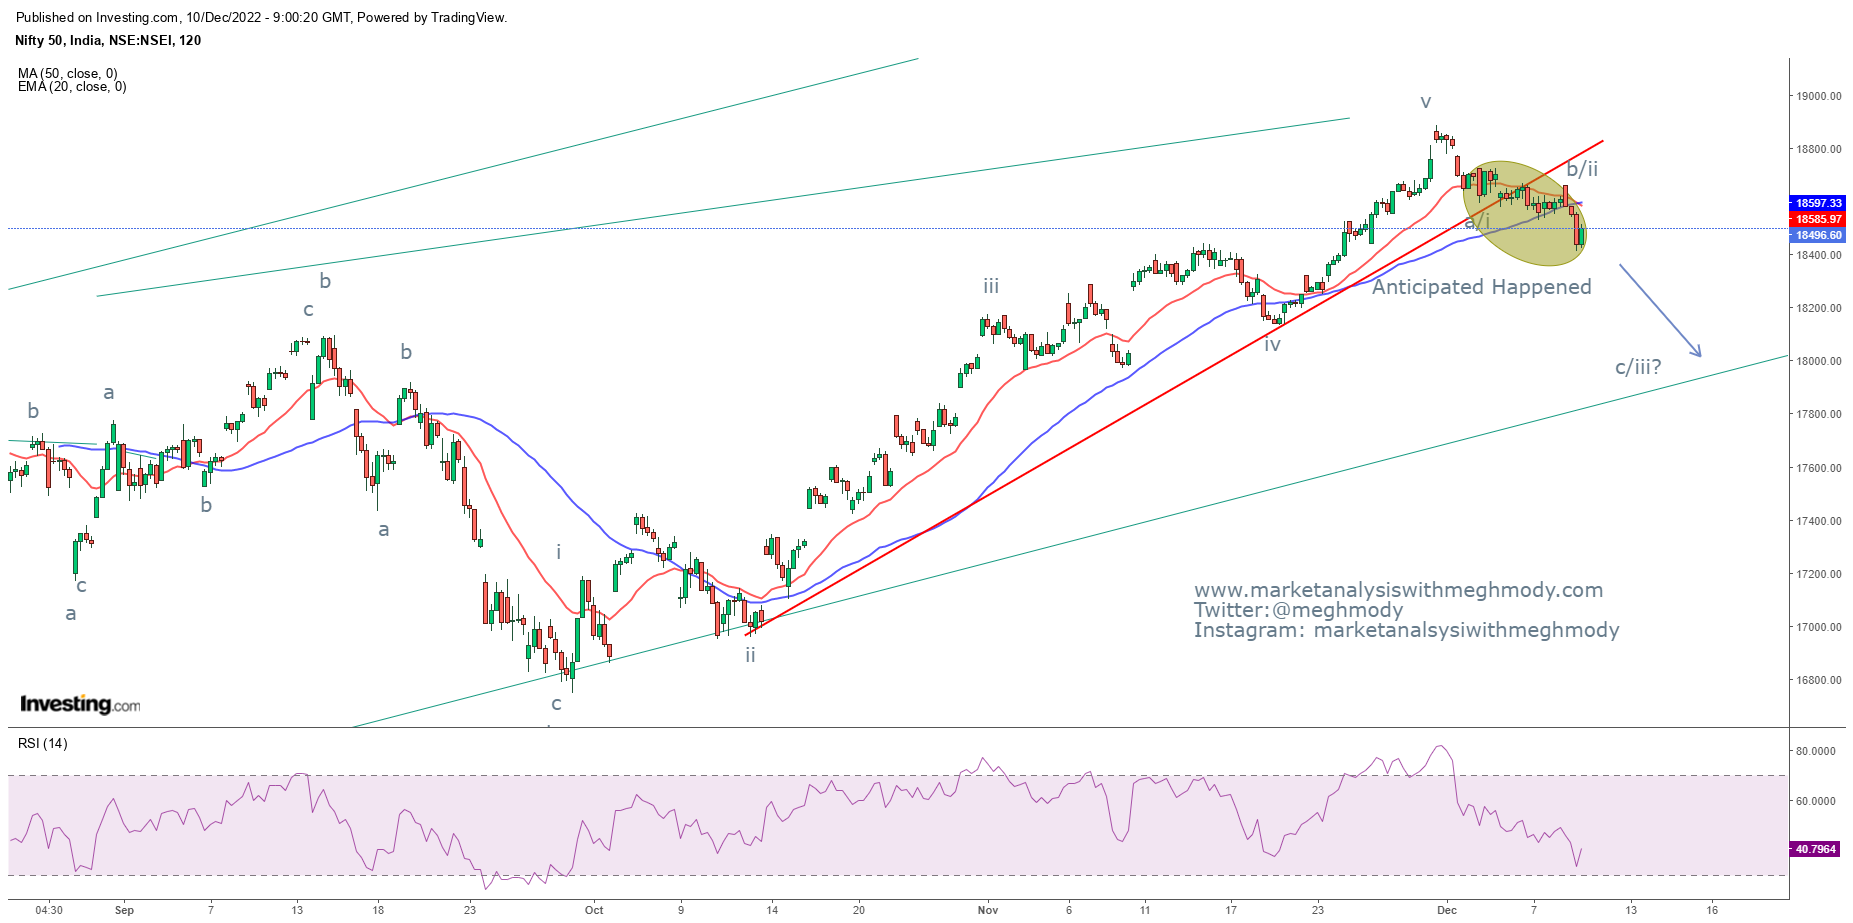
Nifty Anticipated Happened and Elliott Wave Analysis
Nifty 2 hour chart
Analysis
In my previous update
dated 5th Dec I had mentioned, “Nifty possibly can reverse from current
levels and test the support of 18450-18400 levels over short term. The
resistance will be placed at 18900 (closing basis).”
The
index made a low of 18410 which was marked on the last day of the week, thereby
achieving my level – Anticipated Happened
To read my previous article on Nifty, click on the below link
https://www.marketanalysiswithmeghmody.com/2022/12/nifty-and-elliott-wave-analysis.html
From daily chart, the
index continues to be above both the moving averages and it indicates that the
trend is still positive. Any move above 18600 will open further positive
possibilities and can push prices above the previous high. However, a move
below 18400 can drag prices near to 18200 followed by 18050 levels. MACD continues
to give a sell signal with negative divergence.
In 2 hour chart, Nifty
has broken the trend line support (red) and it is below both the moving averages
also there is a bearish crossover which has happened after two months indicating
that the trend is bearish. However, RSI has bounced from the oversold terrain
just to relieve from it.
As per Wave theory, after completing wave v, prices have opened
either impulse or correction in both the cases wave iii/c is pending on the
downside which can go till 18200 followed by 18050 levels.
The summation is
Nifty can further slip towards 18200 followed by 18050 levels. The downside
levels will be negated if prices move above 18600 (closing basis).


Comments