Nifty Bank Elliott Wave Analysis
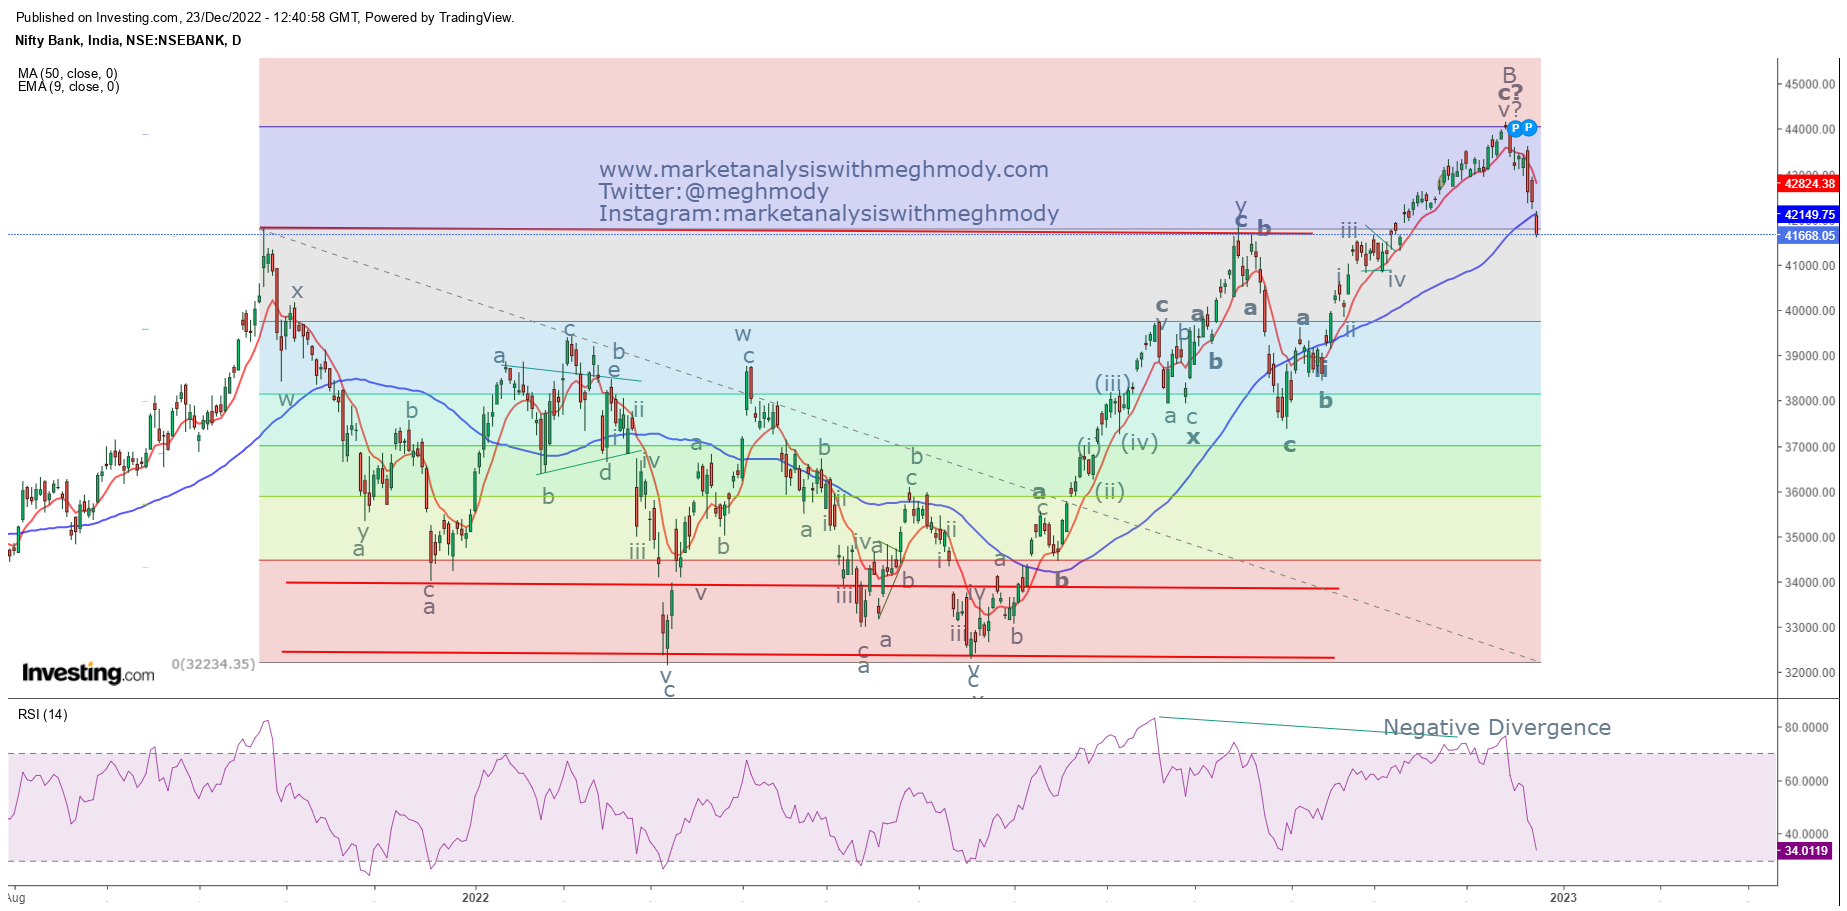
Nifty Bank spot daily chart
Analysis
In my previous update
I had mentioned that, “Nifty Bank is likely to test 43400-43500
levels over short term and can again resume the major trend testing the levels
of 42600 over medium term.”
Nifty bank moved up
as expected and tested the resistance of 43400-43500 levels making a high of
43610 and thereafter it plunged below the level of 42600, thus achieving my
mentioned level – Anticipated Happened.
As shown in the above
daily chart, the benchmark has moved down below both the moving averages which
is first indication of bearishness. However, RSI has arrived near to the
oversold terrain and one can expect that the oscillator can relieve from the
oversold terrain to make vacuum. An unfilled gap down move opens the
possibility of breakaway gap.
As seen in 2 hour
chart, the index has arrived near multiple supports, first is the series of
tops which was earlier acting as resistance now support (role reversal) (red
horizontal line). Also the support of the gap just like Nifty. From here there
is a high possibility for a relief rally to occur which will be short lived and
once it is completed then there will be a resumption of the major trend. ADX is
very strong.
As per Wave theory,
the fall looks impulse and it has completed wave iii*, one can expect that
prices can move near to the zone of 42100-42200 over short term which will
complete wave iv and thereafter it will resume the downtrend in the form of
wave v, which will complete wither wave i of one higher degree or wave a.
The summation is
Nifty Bank can move towards 42100-42200 zone before moving down towards 40900.


Comments