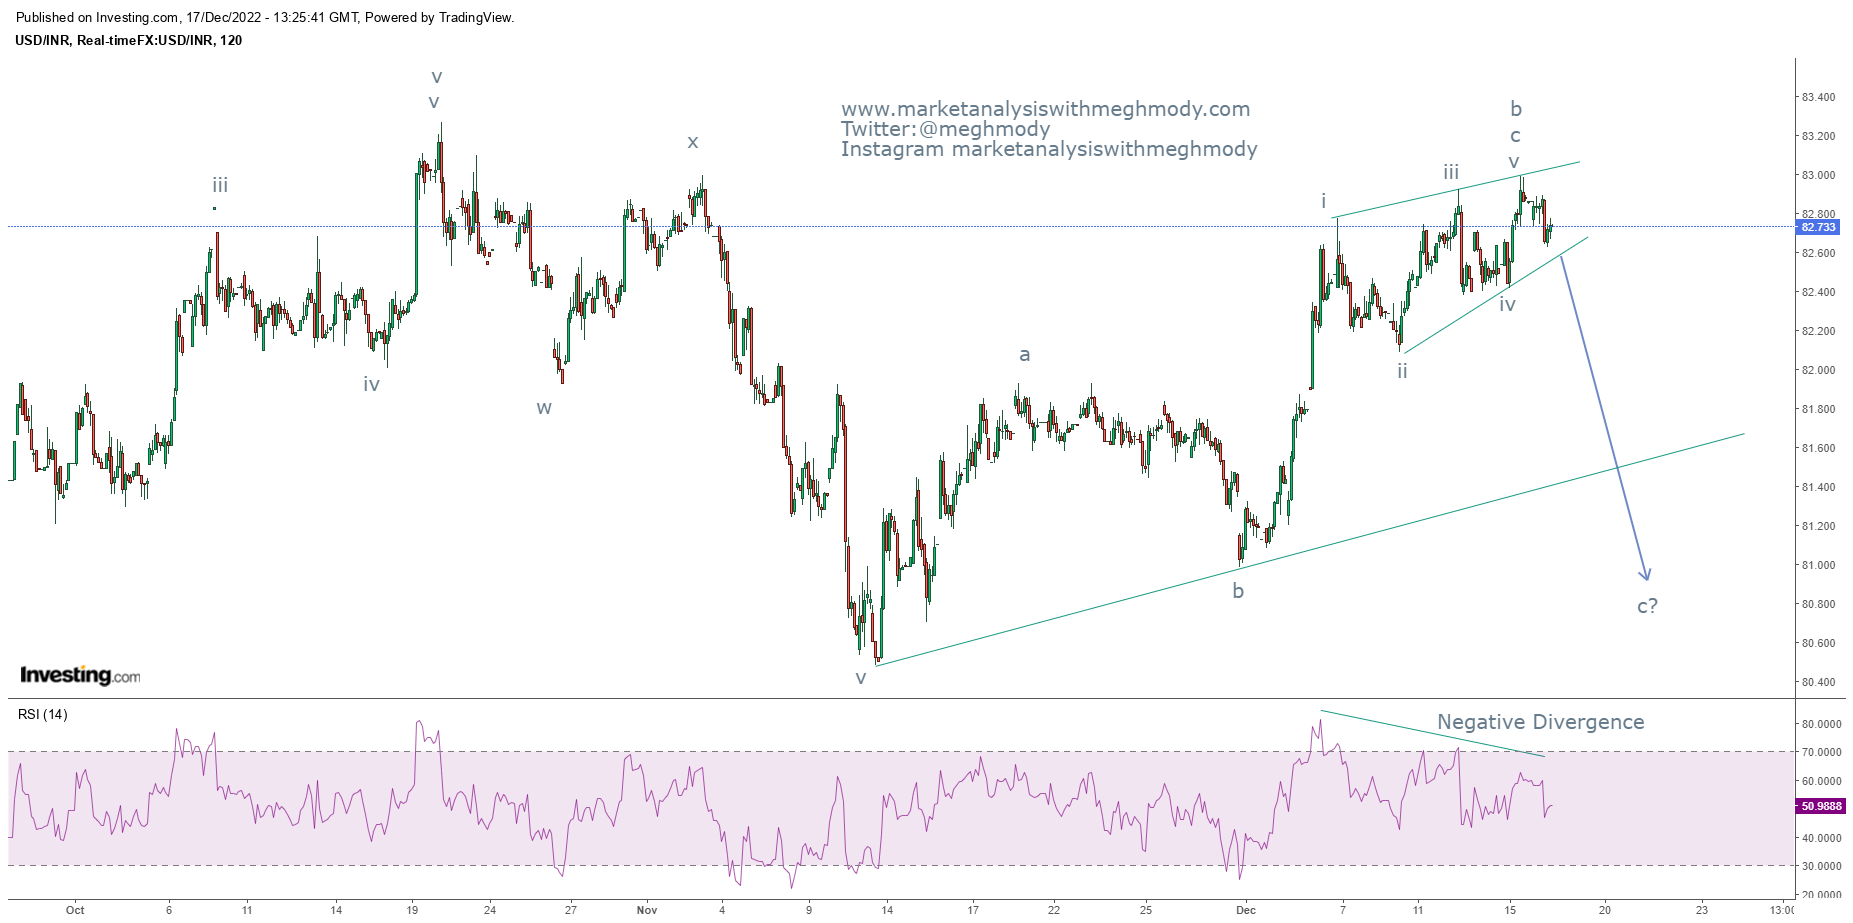
USDINR and Ending Diagonal
USDINR spot hourly chart
Analysis
As shown above chart,
USDINR continues to move in a sideways direction with a slight tilt in price
action. This tilt in common technical terms is formed into a pattern known as
rising wedge. The rising wedge has accompanied with negative divergence in RSI
indicating that the upside is halted. My view in continues to remain negative
but the targets will be revised.
Rising wedges often
gives a negative breakout, it is likely that the pair will move down once the
level of 82.5 is broken which will infuse selling pressure dragging prices
towards 81.8 ort term. It is imperative that pair breaks 81.6 which can
accelerate more selling in this pair.
As per wave theory, prices
have now completed wave b in which wave c has formed an ending diagonal pattern.
A break below 82.50 will confirm that wave c of one higher degree of flat
pattern has started.
The summation is USDINR
is all set to plunge and test 81.8 over short term followed by 80.6, only if
81.6 is broken decisively over medium term.


Comments