MCX Copper Anticipated Happened
MCX Copper daily chart Anticipated Happened
Analysis
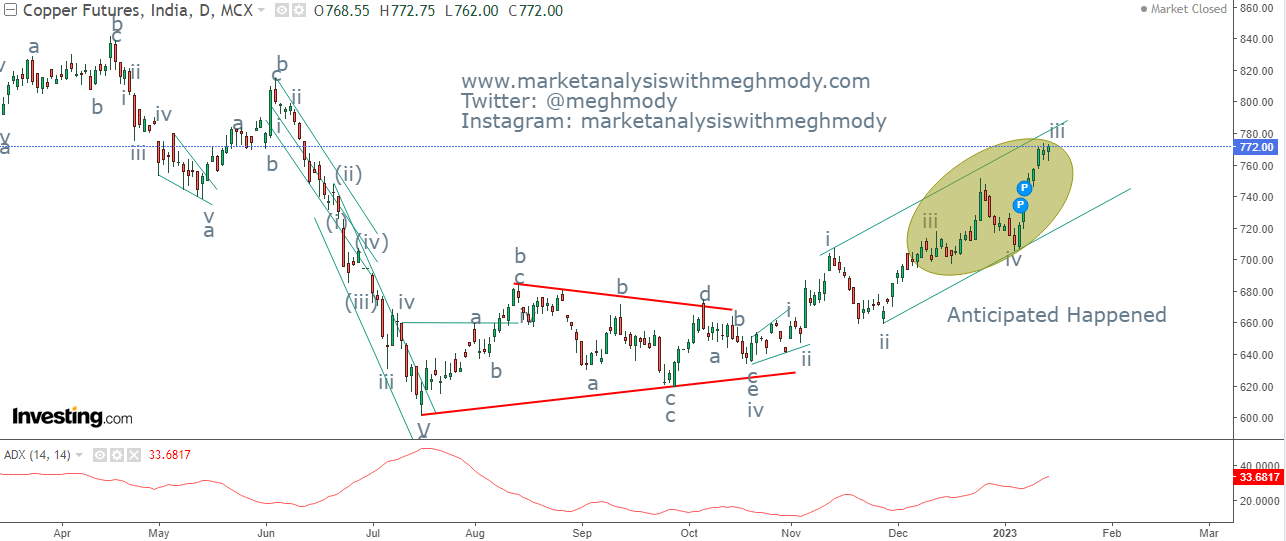
In my previous update on 12th December 2022 I had mentioned , "MCX Copper is set to move in a positive direction and can test the level of 770-776 over short term." MCX Copper has made a high of 773.5 on 12th January 2023 thereby surging 9.56%. - Anticipated Happened
To read my previous article on MCX Copper, click on the below link
The red metal continues to move in a higher highs and higher lows which is a positive formation. Also it is persisting in a rising channel and has arrived near to the resistance of the channel. The level of 770-776 has multiple resistances and it seems that prices can take a breather from hereon.
On ADX front, it is quoting at 33 which indicates that there is a lot of strength in the ongoing uptrend.
From Waves perspective, prices are moving in wave iii or it is on the brink to fade. Prices have arrived near 161.8% of wave i to wave ii giving an indication that wave iv on the downside will start. As wave ii was steep in nature wave iv will be sideways to negative. I expect wave iv to be in the range of 755-745 price range.
The summation is MCX Copper prices can take a breather before resuming the uptrend which can make price move sideways in the range of 755-745 levels.


Comments