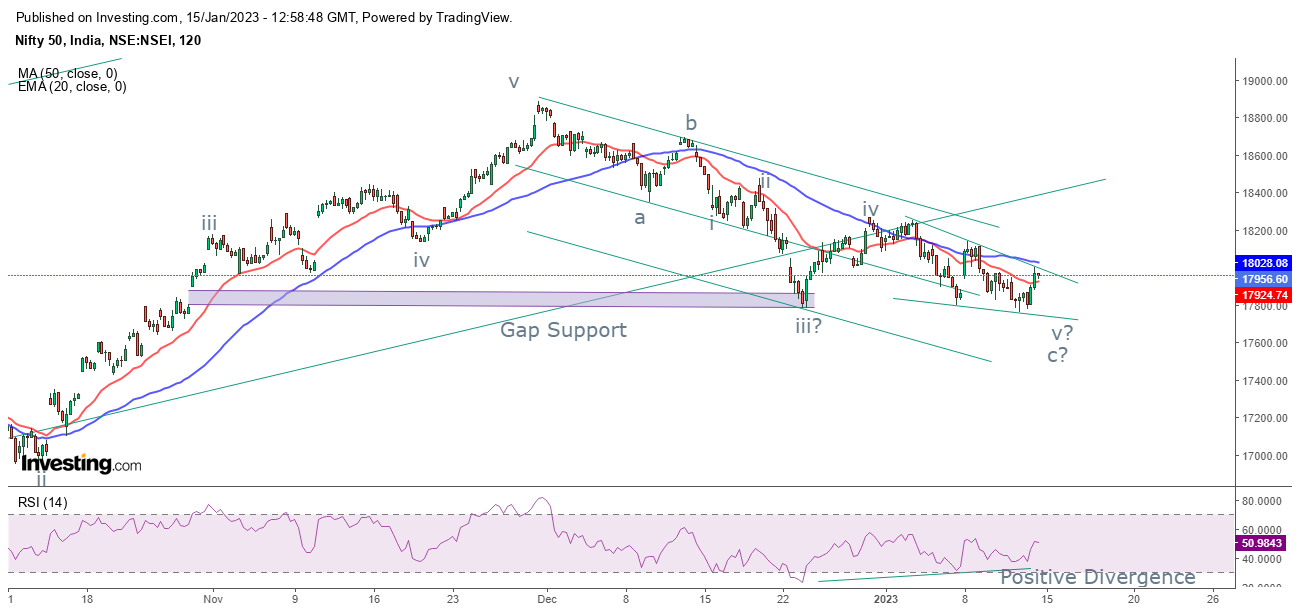
Nifty Elliott Wave Analysis
Nifty 120 mins chart
Analysis
Nifty continues to move in a stiff range of 18100-17750 levels. It seems there is no directional move for the index. However, there is a high possibility for the benchmark to give a move on the higher side soon. On daily chart prices continue to show in a downtrend where it is placed below both the moving averages 50 SMA and 20 EMA. On the downside there are cluster of supports including Gap support, Bollinger Band support (lower band). As far as prices don't breach this support there is a possibility for it to move higher from current levels.
From 120 mins chart, prices are moving in a falling wedge pattern and it seems there is one leg on the downside pending which can drag prices lower till 17800-17750 levels and then it can move towards 18350-18400 levels. RSI on short time frame has started exhibiting positive divergence hinting that limited downside is expected.
As per Wave theory, prices are moving in wave v where ending diagonal is formed, in which it has completed wave iv and wave v on the downside is pending which can plunge price near to the lower end of the diagonal placed at 17800-17750 levels.
The summation is Nifty has one minor leg on the downside towards 17800-17750 which once completed can soar prices towards 18350-18400 levels over short term.


Comments