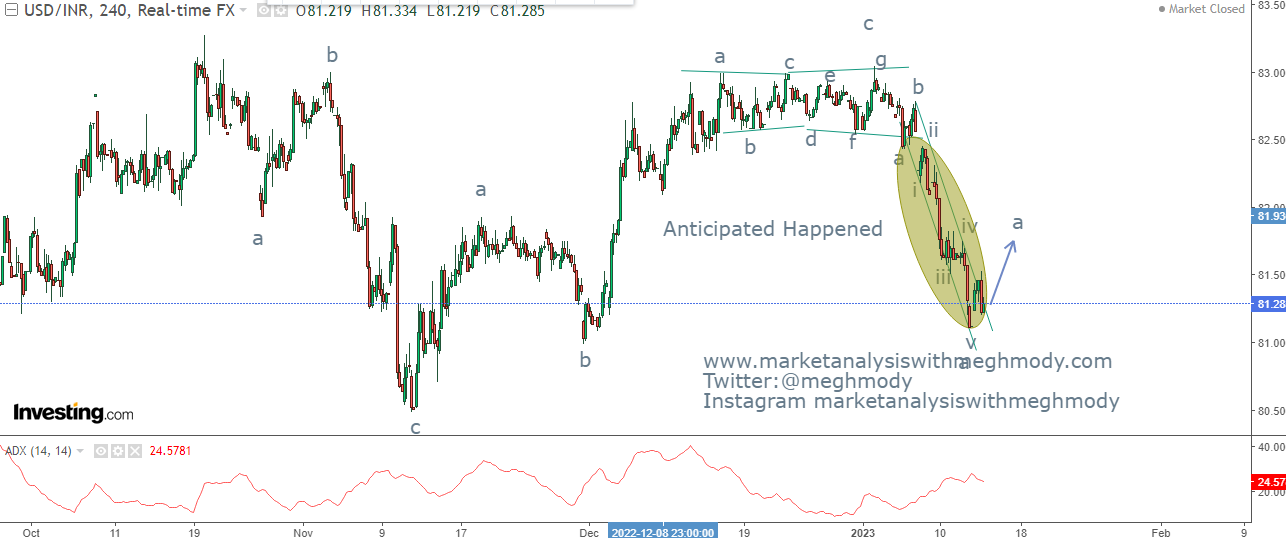
USDINR Anticipated Happened
USDINR 4 hour chart
Analysis
In my previous update dated 8th January 2023 I had mentioned that, "USDINR is negatively firmly negative and can test the level of 82-81.90 over very short term. Break of this level can test 81.50-81.20 levels over short term."
Prices after breaking 82.50 has started falling and reached till 81.80 levels which was also broken decisively thus opening further negative possibilities and achieved my second level of 81.20 thereby fetching 1.60%- Anticipated Happened.
To see my previous article on USDINR, click on the below link
https://www.marketanalysiswithmeghmody.com/2023/01/usdinr-bow-and-tie-diametric-pattern.html
From Waves perspective, prices are moving down in a corrective wave and since it has completed wave c of wave a this will open wave b higher which can go till 81.80 to 82 levels which can be a part of wave a of wave b.
The summation is USDINR can move towards 81.80-82 levels over short term.


Comments