CAC 40: Revisited
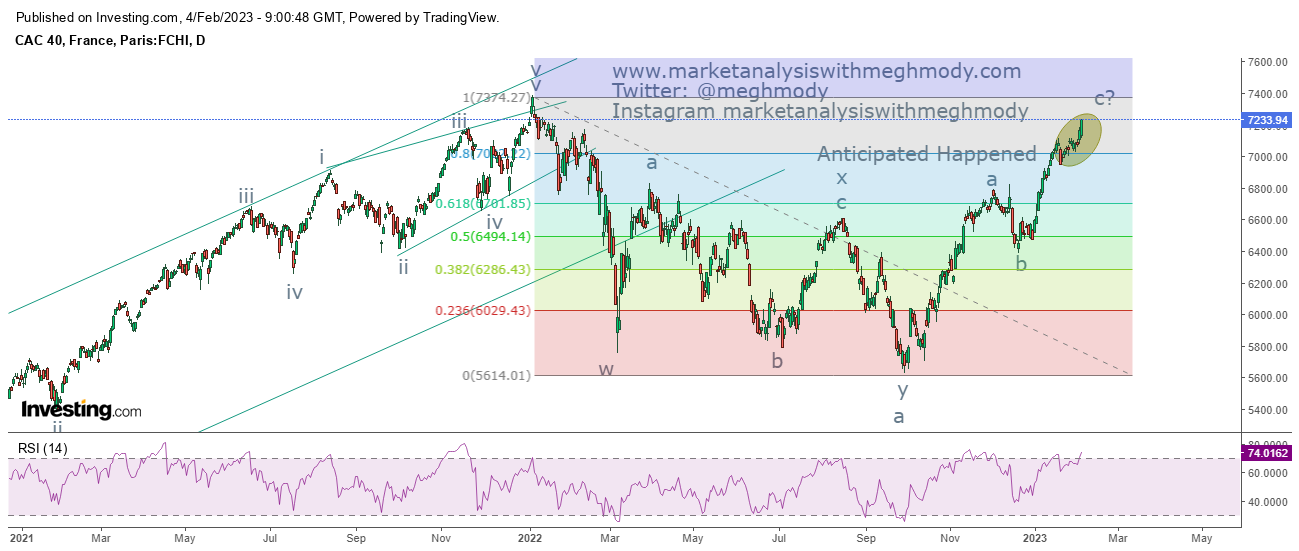
CAC40 daily chart
Analysis
In my previous report I had mentioned that, " CAC40 can move towards 7200-7250 levels from current levels over very short term."
CAC40 which was trading sub 7000 when I wrote this article is now trading at 7233 levels - Anticipated Happened.
To read my previous article on CAC40, click on the below mentioned link
https://www.marketanalysiswithmeghmody.com/2023/01/cac40-elliott-wave-analysis.html
The index is moving near to its previous all time high placed at 7380 levels. It is difficult to come to a conclusion that if it can test this level or not. So I am now cautiously positive for this index and can reverse anytime soon.
As per Wave theory, prices are currently moving in wave B which is on the brink to complete and when it does prices will open in wave C which can drag prices towards 5600 levels.
The summation is CAC40 can turn down anytime soon which will open doors for 5600 on the downside.


Comments